The Puzzle
Why did the largest US tightening since 1980
produce credit expansion in Indonesia?
GFC 2008–09
The textbook risk-off
- Credit growth: −11.5 log points**
- NPL gross: +1.22 pp**
- Foreign capital outflow
- Bank-level signature: contraction
Fed hike 2022–23
Largest US tightening since 1980 — and yet…
- Credit growth: +9.0 log points*
- NPL gross: −1.29 pp**
- No outflow, no panic
- Bank-level signature: expansion
Polar opposite signatures. This paper asks why — and what it means for the framework.
Contribution
Four contributions
-
1First single-country, bank-level testof asymmetric macroprudential effectiveness for Indonesia
-
223-year panel · 97 BUK · 2,055 bank-yearscovers all six major risk-off episodes (GFC, Taper, CNY, EM 2018, COVID, Fed hike)
-
3Identifies the operative shockthe corporate credit spread (BAA − 10Y), not the VIX
-
4Quantifies the asymmetrypost-2017 sensitivity ≈ 4× the pre-2014 magnitude
Where the paper sits
Literature: the asymmetry test missing for Indonesia
Three strands frame the question:
▸ Cross-country evidence of asymmetric macroprudential effectiveness
Cerutti, Claessens & Laeven (2017); Akinci & Olmstead-Rumsey (2018) — tighter on downside than upside
▸ Bank-level transmission of global liquidity
Bruno & Shin (2015); Avdjiev, Du, Koch & Shin (2017) — leverage cycle at sub-annual frequency
▸ Indonesia-specific evidence
Warjiyo (2016); Basri (2017); Soedarmono et al. — aggregate-level or pre-2015 only
The gap →
No single-country bank-level test of asymmetric effectiveness for Indonesia using the full post-Basel III regime.
Data
A 23-year bank-level panel from OJK CFS
97
commercial banks (BUK)
2,055
bank-year observations
17,377
parsed Excel files
99.93%
parse success rate
Outcomes
- Balance sheet: log assets, log credit, log DPK (third-party deposits)
- Risk: Capital Adequacy Ratio (CAR), Non-Performing Loan gross ratio
- Exposure: FX off-balance-sheet commitments / total assets
Bridging (documented, validated)
- Pre-2010 ↔ 2010+ label conventions for balance-sheet items
- Pre-2021 ↔ post-2021 OJK templates for CAR/NPL: Pearson r = 0.9995 / 0.98
- Bulanan ↔ triwulanan FX exposure cross-validation: Pearson r = 0.925
The Global Financial Cycle Factor
Composite factor: PC1 of five US risk-off indicators
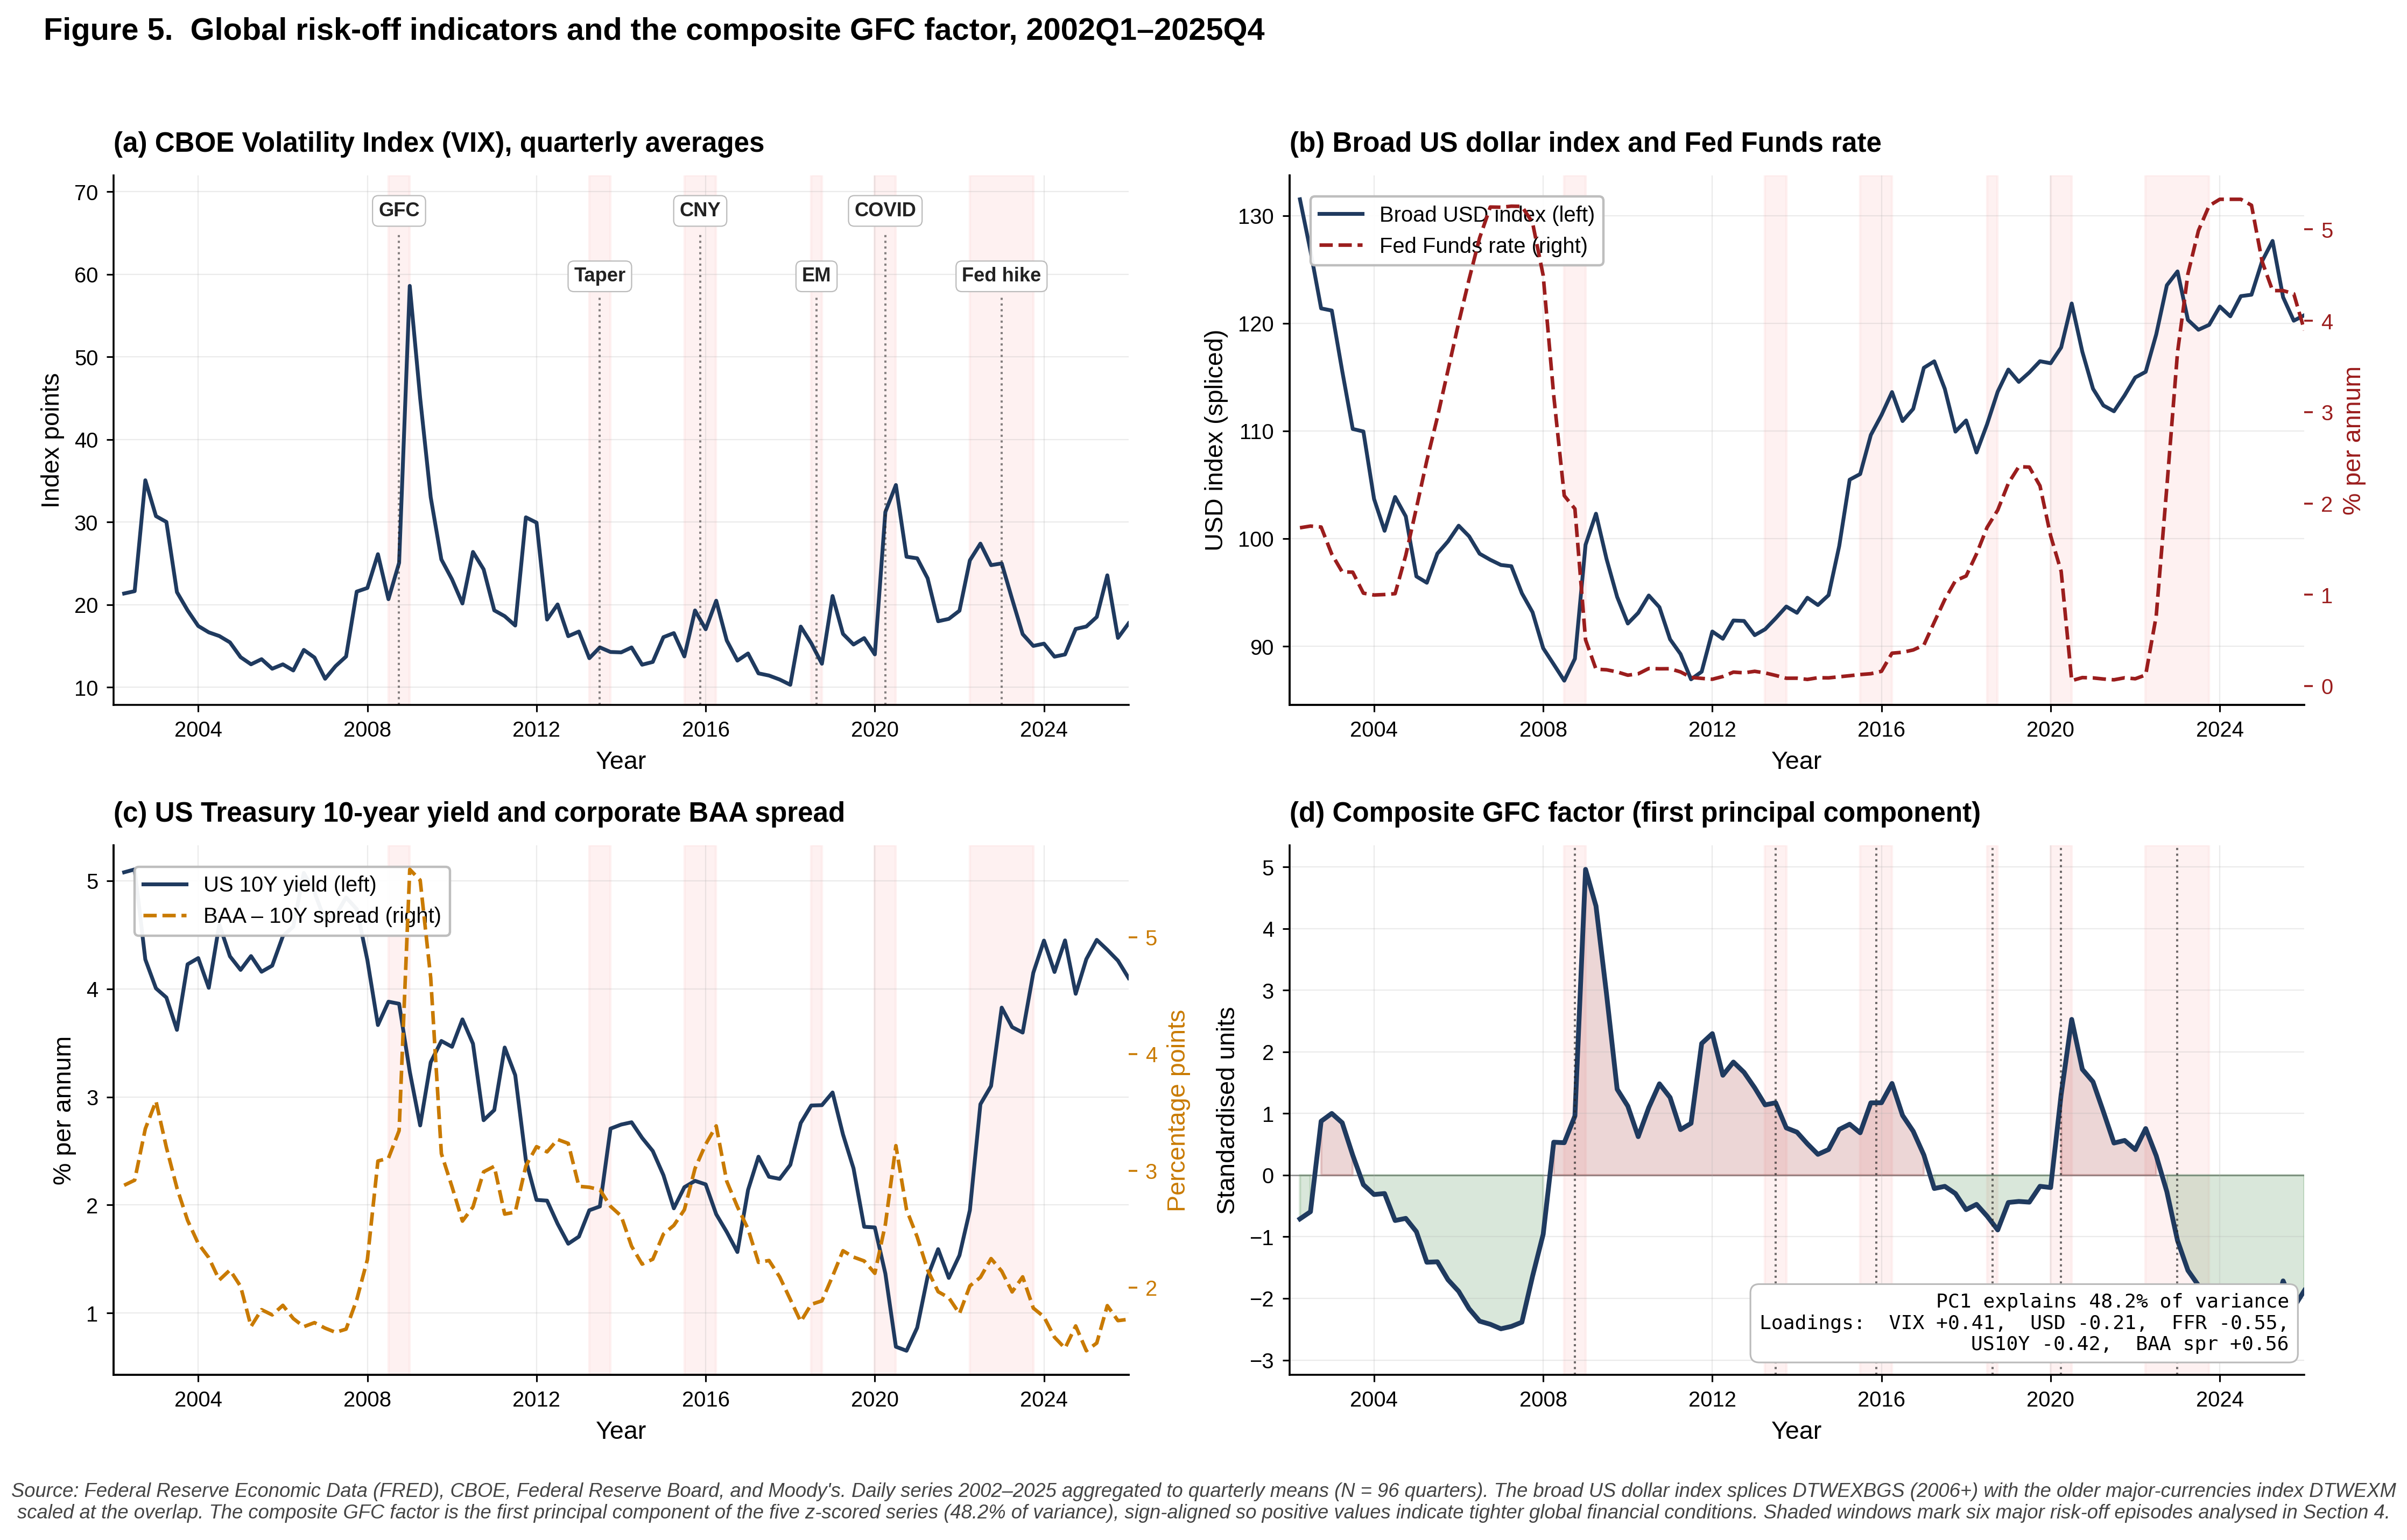
PC1 loadings
(sign-aligned: positive = risk-off)
VIX+0.41
Broad USD−0.21
Fed Funds rate−0.55
US 10Y yield−0.41
BAA spread+0.56
48.2% variance
BAA spread is the largest positive loading → accommodation phase signature, not tightening
Empirical Strategy
Local projections, bank fixed effects
yi,t+h − yi,t = αi + βh · GFCt + γh′ Xi,t−1 + εi,t+h
- Outcomes: log credit, log assets, NPL gross, CAR · horizons h = 1, 2, 3, 5 years
- Bank fixed effects αi absorb time-invariant heterogeneity (business model, ownership, region)
- Lagged controls X: log assets (size), DPK share (funding), credit share (asset mix)
- SE clustered by bank · two-way bank + year as robustness
- Shock: Q1 reading of GFC factor — aligns with April BUK snapshot date
- Identification: GFC factor built entirely from US series → exogenous to single Indonesian bank
Baseline Result
Slow-build response: peak at h = 3, triad signature
| Outcome | h = 1 | h = 2 | h = 3 | h = 5 |
|---|---|---|---|---|
| Δ log credit | −0.003 (0.005) | +0.016* (0.009) | +0.046*** (0.012) | +0.049*** (0.012) |
| Δ log assets | −0.001 (0.003) | +0.008 (0.005) | +0.030*** (0.007) | +0.030*** (0.009) |
| Δ NPL gross (pp) | +0.055 (0.040) | −0.034 (0.064) | −0.254** (0.126) | −0.307*** (0.117) |
| Δ CAR (pp) | +0.162 (0.217) | +0.120 (0.381) | −0.795** (0.333) | −0.498 (0.371) |
At h = 3 — a one-SD GFC shock yields:
+4.6 log pts credit · +3 log pts assets · −25 bp NPL · −80 bp CAR
Triad: credit expansion + asset-quality improvement + capital compression. GFC factor here behaves as accommodation indicator (cheap $ funding + elevated risk premium).
Heterogeneity
Ownership dominates size — implication for D-SIB design
OWNERSHIP
State, BPD, private domestic
CAR support +1.6 to +2.0 pp during stress (vs foreign omitted) — signature of uniform regulator rekapitalisasi, not bank-specific bailout
FX EXPOSURE
Quartile 3–4
Assets contract −0.038 to −0.046 log pts — but loan book is protected. Trading book adjusts first, loan book last.
SIZE QUINTILE
Insignificant across all outcomes
Two banks of identical size but different ownership behave very differently. Current D-SIB designation is partly size-based — the data say size alone misses the relevant heterogeneity.
Centerpiece — The Episode Anomaly
Three regimes across six risk-off episodes
| Episode | Regime | Δ log credit | Δ NPL (pp) |
|---|---|---|---|
| GFC 2008–09 | Textbook | −0.115** | +1.22** |
| Taper tantrum 2013 | Muted | +0.111*** | — |
| CNY / commodity 2015–16 | Muted | +0.065 | — |
| EM contagion 2018 | Muted | −0.033 | — |
| COVID 2020 | Textbook | −0.156*** | — |
| Fed hike 2022–23 | INVERSE ⚡ | +0.090* | −1.29** |
Reading the table
- GFC 2008 + COVID: textbook risk-off contraction
- 2013 / 2015–16 / 2018: muted or absorbed
- Fed hike 2022–23: polar opposite — credit expansion, NPL improved
The polar opposite of 2008–09.
Largest US tightening since 1980 — and the Indonesian banking system expanded credit and improved asset quality.
Robustness
Pre-2014 → Post-2017: ~4× amplification

6 robustness checks on β(h=3)
Baseline: +0.046*** (0.012)
R1 + macro controls+0.047***
R3 two-way SE+0.046***
R4b VIX alone+0.002 (n.s.)
R4c BAA spread alone+0.047**
R5a pre-2014+0.033***
R5b post-2017+0.130***
R6 trim p99+0.040***
BAA spread = operative shock
Post-2017 ≈ 4× pre-2014
Post-2017 ≈ 4× pre-2014
Interpretation
The asymmetry: what the instruments bind on
✓ Downside contained
- 2022–23 Fed hike: credit expanded, NPL improved
- CAR support uniform across state, BPD, private domestic
- Orderly FX deleveraging — trading book first, loan book last
- LTV, CCyB, loss-provisioning bind on losses & on CAR
✗ Upside not contained
- Pre-2014 β ≈ 0.033 → Post-2017 β ≈ 0.130 (≈ 4× amplification)
- During accommodation: NPLs fall, CAR comfortable
- Median bank CAR = 22% against 8% regulatory floor — tools do not bind
- Credit boom propagates; exposures build up
Policy Implications
Four instruments to close the upside gap
-
1CCyB triggered by BAA spreadUse the corporate credit spread (the operative shock identified by the data), not VIX, not domestic credit-to-GDP gap alone
-
2Exposure-cap tools (GWM Valas)Bind on exposure, not loss — exactly what loss-recognition tools fail to do during accommodation
-
3D-SIB designation by ownershipOwnership type dominates size in heterogeneity — current size-based designation misses the relevant differentiation
-
4Preserve forbearance budgetsThe uniform CAR-support signature in the data is consistent with forbearance and should be retained as a deliberate framework feature
Limitations · Next Steps
Honest limitations point to follow-up work
Limitations
- Annual frequency: CAR/NPL only at Q1 (April) snapshot — sub-annual dynamics blurred
- 2016 structural gap in OJK public archive — absorbed into year fixed effects
- Ownership classification static (2021–2024 top-owner average) — pre-2021 M&A not captured
- No loan-level granularity — borrower-side mechanism unobserved
Next steps
- Quarterly extension once 2021+ triwulanan sample matures
- Historical-ownership robustness using OJK annual reports
- Syariah banking system extension (BUS panel from 2010)
- Loan-level micro-data via SLIK access (regulatory permission required)
Conclusion
Indonesia’s post-2016 macroprudential framework
contains the downside of the global cycle
but not the upside.
contains the downside of the global cycle
but not the upside.
The build-up of exposures during accommodation phases
remains an open margin for policy design.
remains an open margin for policy design.
Thank you. I welcome your questions.
Ahmad Fatikhul Khasan · HAMPARAN Institute
[email protected] · ORCID 0000-0003-0209-834X