The stabilisation question the East Java TPID actually faces
The provincial and 38 regency-level Tim Pengendalian Inflasi Daerah (TPID) run a monthly food-price monitoring cadence, coordinated with Bank Indonesia's Regional Inflation Coordination Meeting.
The National Oceanic and Atmospheric Administration publishes the Oceanic Niño Index (ONI) every month with a 3–6 month leading window. It is free, real-time, and covers Indonesia's most consequential climatic driver.
Yet the current stabilisation architecture treats all commodities uniformly — the same buffer-stock rules, the same import-licence timing, the same operasi-pasar triggers apply to garlic and to beef alike.
The question
"Which of the 18 strategic commodities monitored by TPID actually need ENSO-contingent stabilisation, and at what lag?"
No published sub-national panel exists to answer this at the regency scale over a nine-year window.
The regency layer the existing evidence skips
Global-commodity ENSO literature
Brunner (2002); Cashin, Mohaddes & Raissi (2017); Ubilava (2012–2018); Damette (2024)
- Documents that ENSO raises world non-fuel commodity prices
- Operates at global aggregate — cannot answer which Indonesian commodities and where
Indonesian food-inflation literature
Naylor et al. (2001, 2007); Iizumi et al. (2014); Ismaya & Anglingkusumo (2018)
- Documents ENSO effects on rice planting dates and yields
- National-aggregate or coarse-provincial level; rarely descends to monthly or quarterly retail-price variation at the sub-national scale
The gap this paper fills. The SISKAPERBAPO price-monitoring system publishes daily retail prices for the 38 regencies and cities of East Java from 2017. This paper builds the first regency × commodity × quarter panel to bring the sub-national granularity that operational stabilisation policy actually requires.
Three contributions in a single panel
-
1Empirical — the first regency-level ENSO transmission panel for Indonesian food38 regencies and cities × 19 commodities × 34 quarters ≈ 24,000 observations from SISKAPERBAPO daily. Nine-year window covering pre-COVID, pandemic, and post-2022 macroeconomic-shock regimes.
-
2Methodological — systematic heterogeneity ranking with tier classificationPanel two-way fixed-effects with Driscoll–Kraay standard errors and a disciplined best-lag selection rule partition the 18 main-sample commodities into STRONG / MODERATE / WEAK tiers by absolute t-statistic. The tier structure is stable across a five-specification robustness battery.
-
3Policy — a differential stabilisation framework the TPID can operationalise nowThree operational principles derived directly from the empirical structure: differential (not uniform) protection, lag-aware procurement, and quarterly ONI-anchored monitoring. All three require no new information infrastructure — only a mapping table appended to the existing TPID monthly report.
SISKAPERBAPO · a 9-year regency panel
Sources: SISKAPERBAPO retail prices (Dinas Perindustrian dan Perdagangan Provinsi Jawa Timur); NOAA Climate Prediction Center Oceanic Niño Index (quarterly, 1950–2026); NASA POWER daily precipitation (2017–2026); GADM 4.1 administrative-area polygons.
Access: SISKAPERBAPO retrieval requires an Indonesian residential IP path. The reverse-SOCKS operational workaround is documented in Appendix A of the manuscript for reproducibility.
Panel two-way fixed effects · Driscoll–Kraay inference
- πc,i,t — quarterly year-on-year price growth of commodity c in regency i in quarter t
- αc,i — regency fixed effect (absorbs time-invariant local conditions)
- ONIt − kc — Oceanic Niño Index at best-fit lag kc ∈ {0, 1, 2, 3} quarters
Best-lag selection rule
Estimate at each of four candidate lags; select the lag that maximises within-R² conditional on p < 0.10. If no lag clears the significance floor, the commodity is retained but flagged WEAK-tier.
Prioritises statistical significance over raw magnitude — appropriate for the ~1,000-observation regressions.
Standard errors: Driscoll–Kraay (Bartlett kernel, bandwidth 2 quarters) — robust to arbitrary spatial dependence across regencies within-period and to serial correlation within-regency, under fixed-T asymptotics. Two-way clustered (regency × time) inference reported as R1 robustness.
The four channels the lag structure predicts
| Channel | Best lag | Commodity examples | Biology / trade mechanism |
|---|---|---|---|
| 1 · Direct production | 0Q | Shallot, rice, cooking oil | Local rainfall affects same-quarter harvest and CPO refining flow |
| 2 · Feed-cost cascade | 1–2Q | Local & imported soybean → layer-hen egg, broiler | Corn and soybean-meal inputs propagate through feed compound to poultry |
| 3 · Sugarcane cycle | 2Q | Refined white sugar | ENSO affects the April–November dry-season milling window sucrose yield |
| 4 · Import-parity | 0Q | Garlic (Shandong), imported soybean | Contemporaneous global-supply shocks transmit through trade prices |
The empirical fingerprint hypothesis. If lag distribution maps cleanly to supply-chain biology, the panel FE recovers economic channels — not a statistical artefact. The results below confirm this mapping to a degree that provincial-aggregate analyses systematically cannot.
Panel FE estimates · 17 main-sample commodities
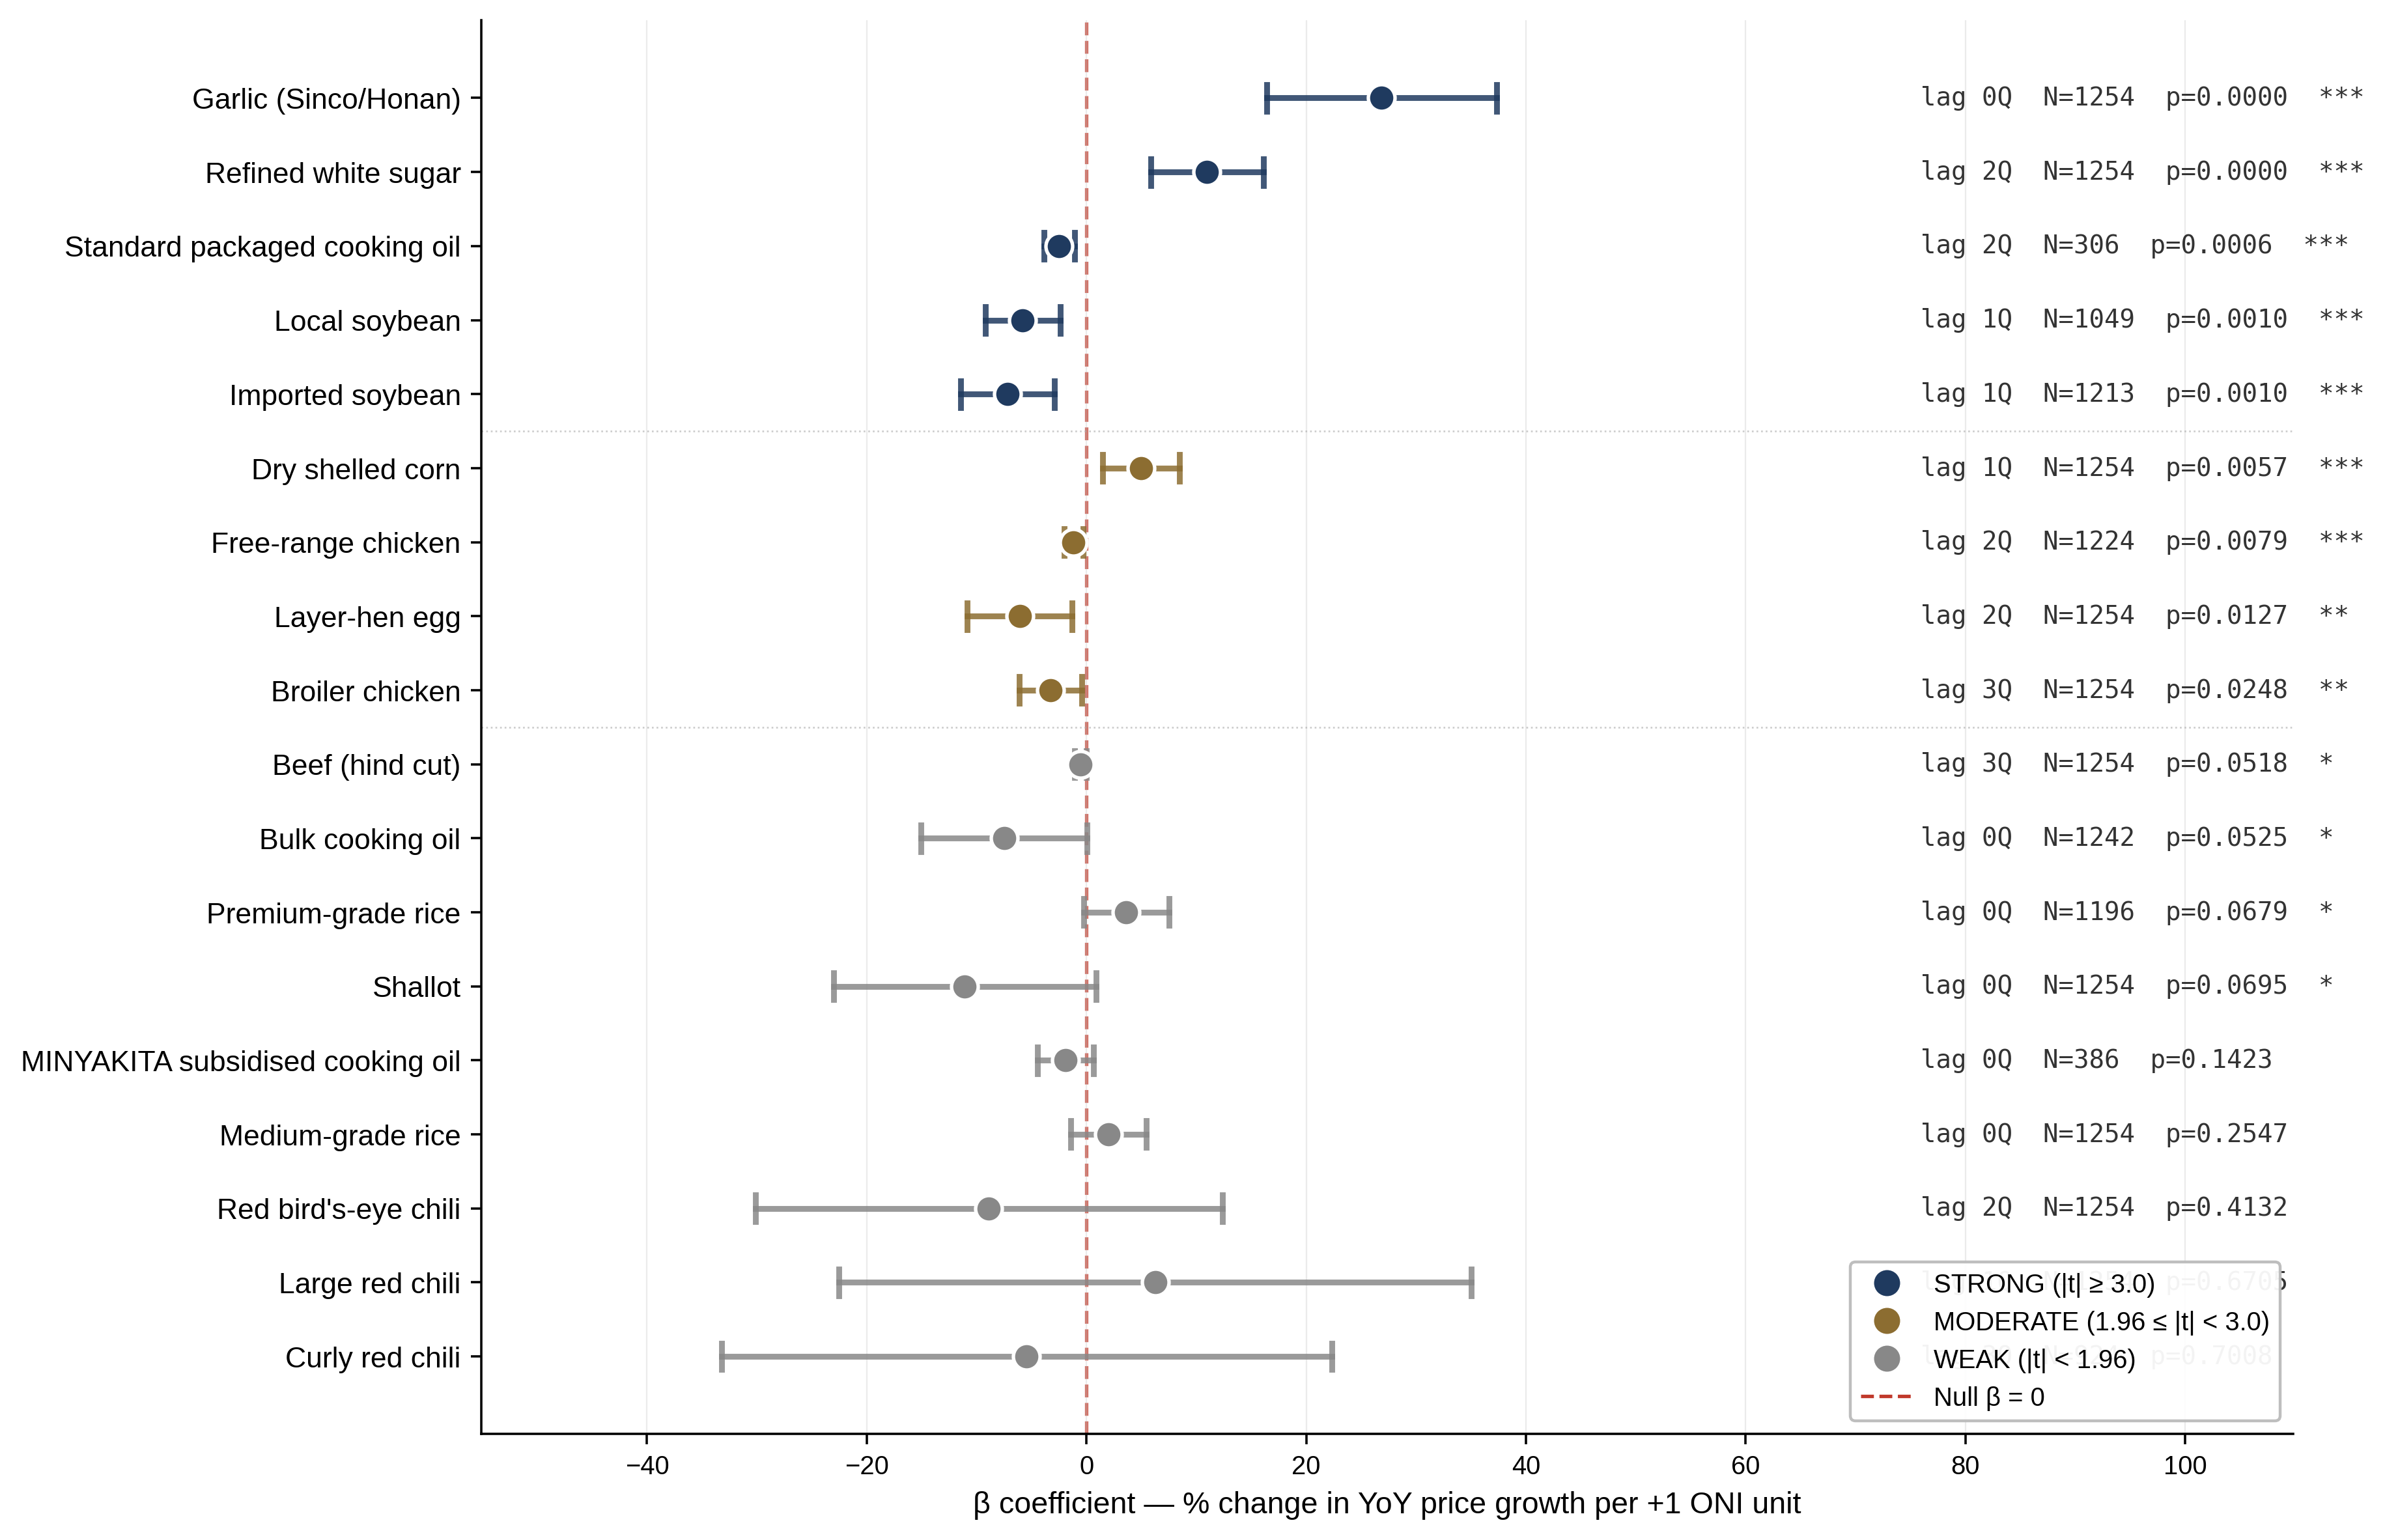
The 13-vs-5 sign asymmetry the regency panel reveals
| Direction | N commodities | Interpretation |
|---|---|---|
| β < 0 (negative) | 13 | La Niña-victim — wet-season floods raise price |
| β > 0 (positive) | 5 | El Niño-victim — dry conditions raise price |
The five positive commodities are: garlic (Shandong import), refined white sugar (sugarcane cycle), dry shelled corn, large red chili, premium-grade rice.
The earlier provincial-aggregate analysis reported a near-balanced 9-vs-8 split. The regency panel corrects an aggregation-bias artefact by identifying the systematic within-regency response independently of the between-regency compositional mix.
Robustness of the sign at the regency level
For shallot — the archetypal La Niña-victim commodity — 37 of 38 regencies and cities return the same sign in a per-regency regression at lag 0Q. Sign flip is not driven by a single dominant unit.
Full per-regency shallot β distribution in the supplementary figure set.
Uniform stabilisation is inconsistent with the evidence
The five STRONG-tier commodities carry β magnitudes an order of magnitude larger than the WEAK tier —
and their lag structure maps cleanly to supply-chain biology.
The same buffer-stock rule cannot be efficient across both.
Garlic (import-parity, 0Q, β = +26.85) requires immediate response.
Refined white sugar (sugarcane cycle, 2Q, β = +10.98) admits two quarters of preparation.
Broiler chicken (feed cascade, 3Q, β = −5.11) permits three quarters of procurement adjustment.
Five alternative specifications · STRONG tier preserved
| Specification | What it stresses | STRONG preserved |
|---|---|---|
| R1 Two-way clustered SE | Alternative variance estimator (regency × time) | 5 / 5 |
| R2 Drop COVID quarters (2020Q2–Q4) | Pandemic-period sensitivity | 5 / 5 |
| R3 Pre-2022 sub-sample | Sample split — before structural shocks | 5 / 5 |
| R4 Post-2022 sub-sample | Sample split — after Russia–Ukraine, MINYAKITA scheme, DMO shifts | 5 / 5 |
| R5 Contemporaneous-only (all commodities at 0Q) | Rules out best-lag data mining | 4 / 5 |
The single commodity that loses statistical significance under R5 — refined white sugar — is the archetypal 2Q sugarcane-cycle case. Losing significance at 0Q confirms rather than undermines the paper's lag-structure narrative.
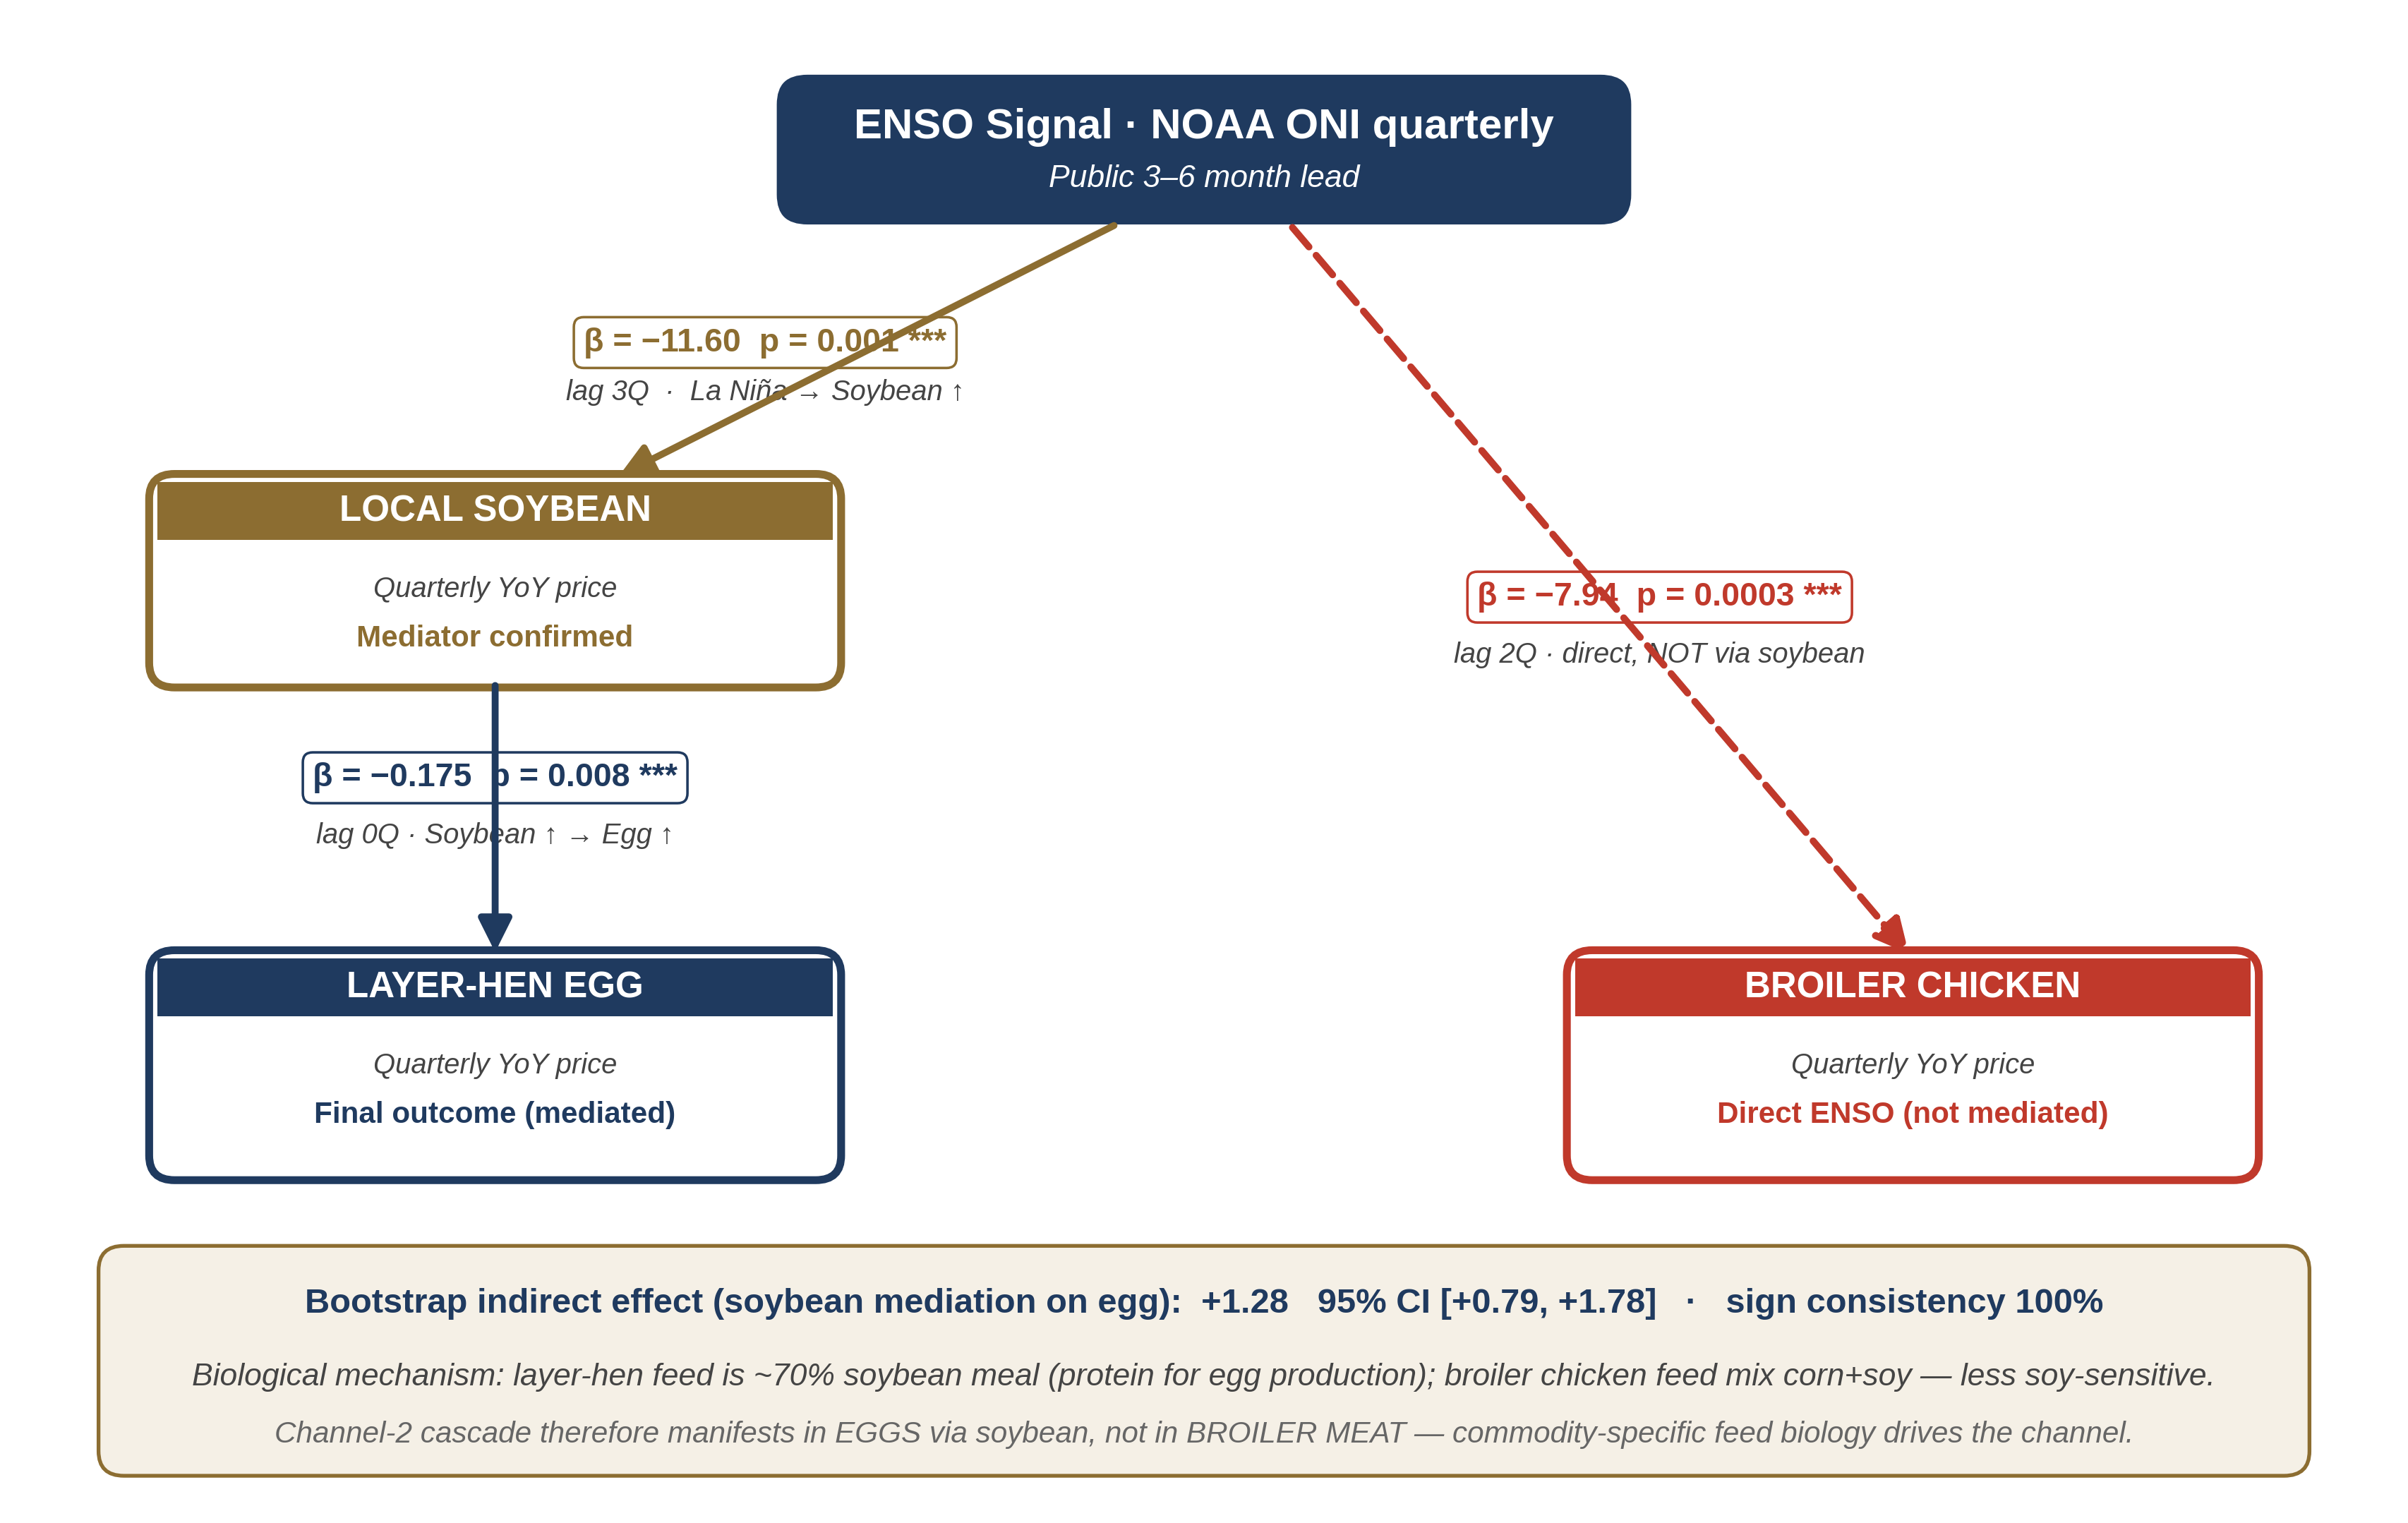
The Baron–Kenny mediation on soybean → egg
What the paper does not claim
Identification limits
- Panel FE identifies the average within-regency response — regency-specific responses can differ meaningfully
- The post-2022 sub-sample coefficients are the most operationally relevant for going-forward stabilisation, given the structural break
- The Channel-2 mediation attenuates in the full sample; the paper reports this honestly rather than restricting to the confirming window
Scope limits
- The paper is not a policy evaluation of any existing buffer-stock, import-licence, or operasi-pasar programme
- The framework generalises to any Indonesian province with an equivalent daily-price monitoring system, but only East Java is empirically evaluated here
- Long-horizon (2+ year) ENSO transmission through capital-stock investment channels is out of scope
Three operational principles · one dashboard
-
1Differential rather than uniform protectionThe five STRONG-tier commodities warrant commodity-specific ENSO-contingent responses; the nine WEAK-tier commodities do not. Resources released from blanket coverage can be reallocated to the high-sensitivity subset.
-
2Lag-aware procurement calibrated to commodity biologyGarlic (0Q) needs immediate response to ONI shifts. Refined white sugar and layer-hen egg (2Q) admit a two-quarter procurement window. Broiler chicken (3Q) permits three quarters of preparation.
-
3Quarterly ONI-anchored monitoring — free 3–6 month leadAttach a one-page climate-and-commodity outlook to the existing monthly TPID inflation-monitoring report using the coefficient mapping in Table 2. No new information infrastructure required.
Regency granularity as the operational unit of price policy
The regency panel identifies structure that provincial-aggregate work systematically misses
— structure that can be operationalised now, without new data infrastructure,
by the East Java Tim Pengendalian Inflasi Daerah.
The framework generalises to any Indonesian province with equivalent daily price-monitoring infrastructure:
West Java (Priangan Timur) · Central Java (Solo Raya) · South Sumatra · South Sulawesi.
Replication package
Cleaned regency-quarterly panel · panel-FE estimation code · robustness battery · figure-generation scripts · Baron–Kenny mediation implementation. Released as open resource upon publication.
Contact
Ahmad Fatikhul Khasan
HAMPARAN Institute, Jember, Indonesia
[email protected]
ORCID: 0000-0003-0209-834X