Global Financial Cycle Transmission to Indonesian Bank Balance Sheets v2.7 — FULL DRAFT end-to-end
BUK panel evidence, 2002–2025. Seven figures + ten tables + three LaTeX-rendered equations. Full draft complete: Abstract → Conclusion. Last build: 2026-05-27.
Submit to https://submit.confbay.com/conf/bmeb2026 or email [email protected].
Manuscript: 11 sections + references + Appendix A/B/C · ~10,900 words · 7 embedded figures · 10 tables · 3 LaTeX-rendered equations · 37 verified references · JEL codes G21, F32, E58, G28.
v2.7 milestone (2026-05-27) — FULL DRAFT COMPLETE end-to-end:
All 11 sections drafted and tightened through section-by-section vibe-check cycles. Manuscript covers Abstract → Introduction → Related literature (5 strands) → Data (7 sub-sections + Table 1 Data Scope) → Empirical strategy (4 sub-sections + 3 LaTeX equations) → Main results (4 sub-sections, slow-build + accommodation-phase reading) → Heterogeneity (2 sub-sections, recapitalisation signature + FX channel) → Episode event-study (4 sub-sections, three-regime taxonomy) → Robustness (3 sub-sections, BAA-spread shock decomposition) → Asymmetric-macroprudential interpretation (3 sub-sections, "asymmetry by design, not by failure") → Discussion & policy implications (4 sub-sections, exposure-cap toolkit + forbearance budget + credit-spread monitoring) → Conclusion (3 paragraphs, framework-mature-but-calibration-frontier-open closing).
Analytical contributions baked in: (1) slow-build transmission profile with accommodation-phase reading of the GFC factor; (2) asymmetric capital-management triad at bank level (credit ↑ NPL ↓ CAR ↓); (3) recapitalisation signature uniformly across all three domestic ownership classes (not state-specific) → regulator-uniform forbearance hypothesis; (4) trading book retreats before loan book in FX channel; (5) three-regime episode taxonomy with 2008-vs-2022 regime-shift (20-log-point swing); (6) BAA corporate-credit spread is the operative shock, not VIX (R4b/R4c decomposition); (7) post-2016 sensitivity 3-4× pre-2014; (8) framework-level asymmetry by instrument design.
Policy frontier identified: foreign-currency reserve requirements (GWM Valas), surge-cyclical CCB calibration triggered by BAA spread (not credit-to-GDP), and binding FX-exposure caps on Q3/Q4 banks. Plus monitoring-side reform: replace VIX with BAA spread as the cross-border-cycle indicator. Plus forbearance-budget rule for the regulator-uniform recapitalisation pattern.
What remains before submission: (a) ✅ citation-integrity audit COMPLETE 2026-05-27: all 37 references verified via WebSearch / primary-source spot-check; zero phantom citations; zero dead refs; body↔refs cross-check 100%; (b) visual rendering polish in DOCX (table column widths, equation alignment fine-tuning); (c) LaTeX → BMEB-compliant PDF conversion (Task #21, deferred); (d) bos's deep-read pass + Q&A iteration on detailed content.
1. Research design — one paragraph
Local-projection (Jordà 2005) bank-level panel regressions of log-credit, NPL, and CAR on (a) the composite GFC factor and (b) episode-dummy event studies, with bank fixed effects and time controls. Heterogeneous effects identified through interactions with bank size (asset quintile), funding structure (DPK share of liabilities), and a foreign-currency exposure proxy built from the off-balance-sheet komitmen-kontinjensi data. The 2002–2025 panel covers six major risk-off windows: GFC 2008-09, Taper tantrum 2013, CNY / commodity bust 2015-16, EM contagion 2018, COVID 2020, Fed hike cycle 2022-23.
2. Figure 1 — Global risk-off indicators and the composite GFC factor
Figure 1. Global risk-off indicators and the composite GFC factor, 2002Q1–2025Q4
Four panels assemble the global financial-cycle inputs: VIX, broad USD index (spliced DTWEXBGS + DTWEXM), Fed Funds rate, US 10-year yield, and the BAA – 10Y corporate-credit spread. Panel (d) plots the first principal component of all five z-scored indicators (48.2 % of variance, sign-aligned so positive = risk-off). Brick shading marks six pre-specified episode windows.
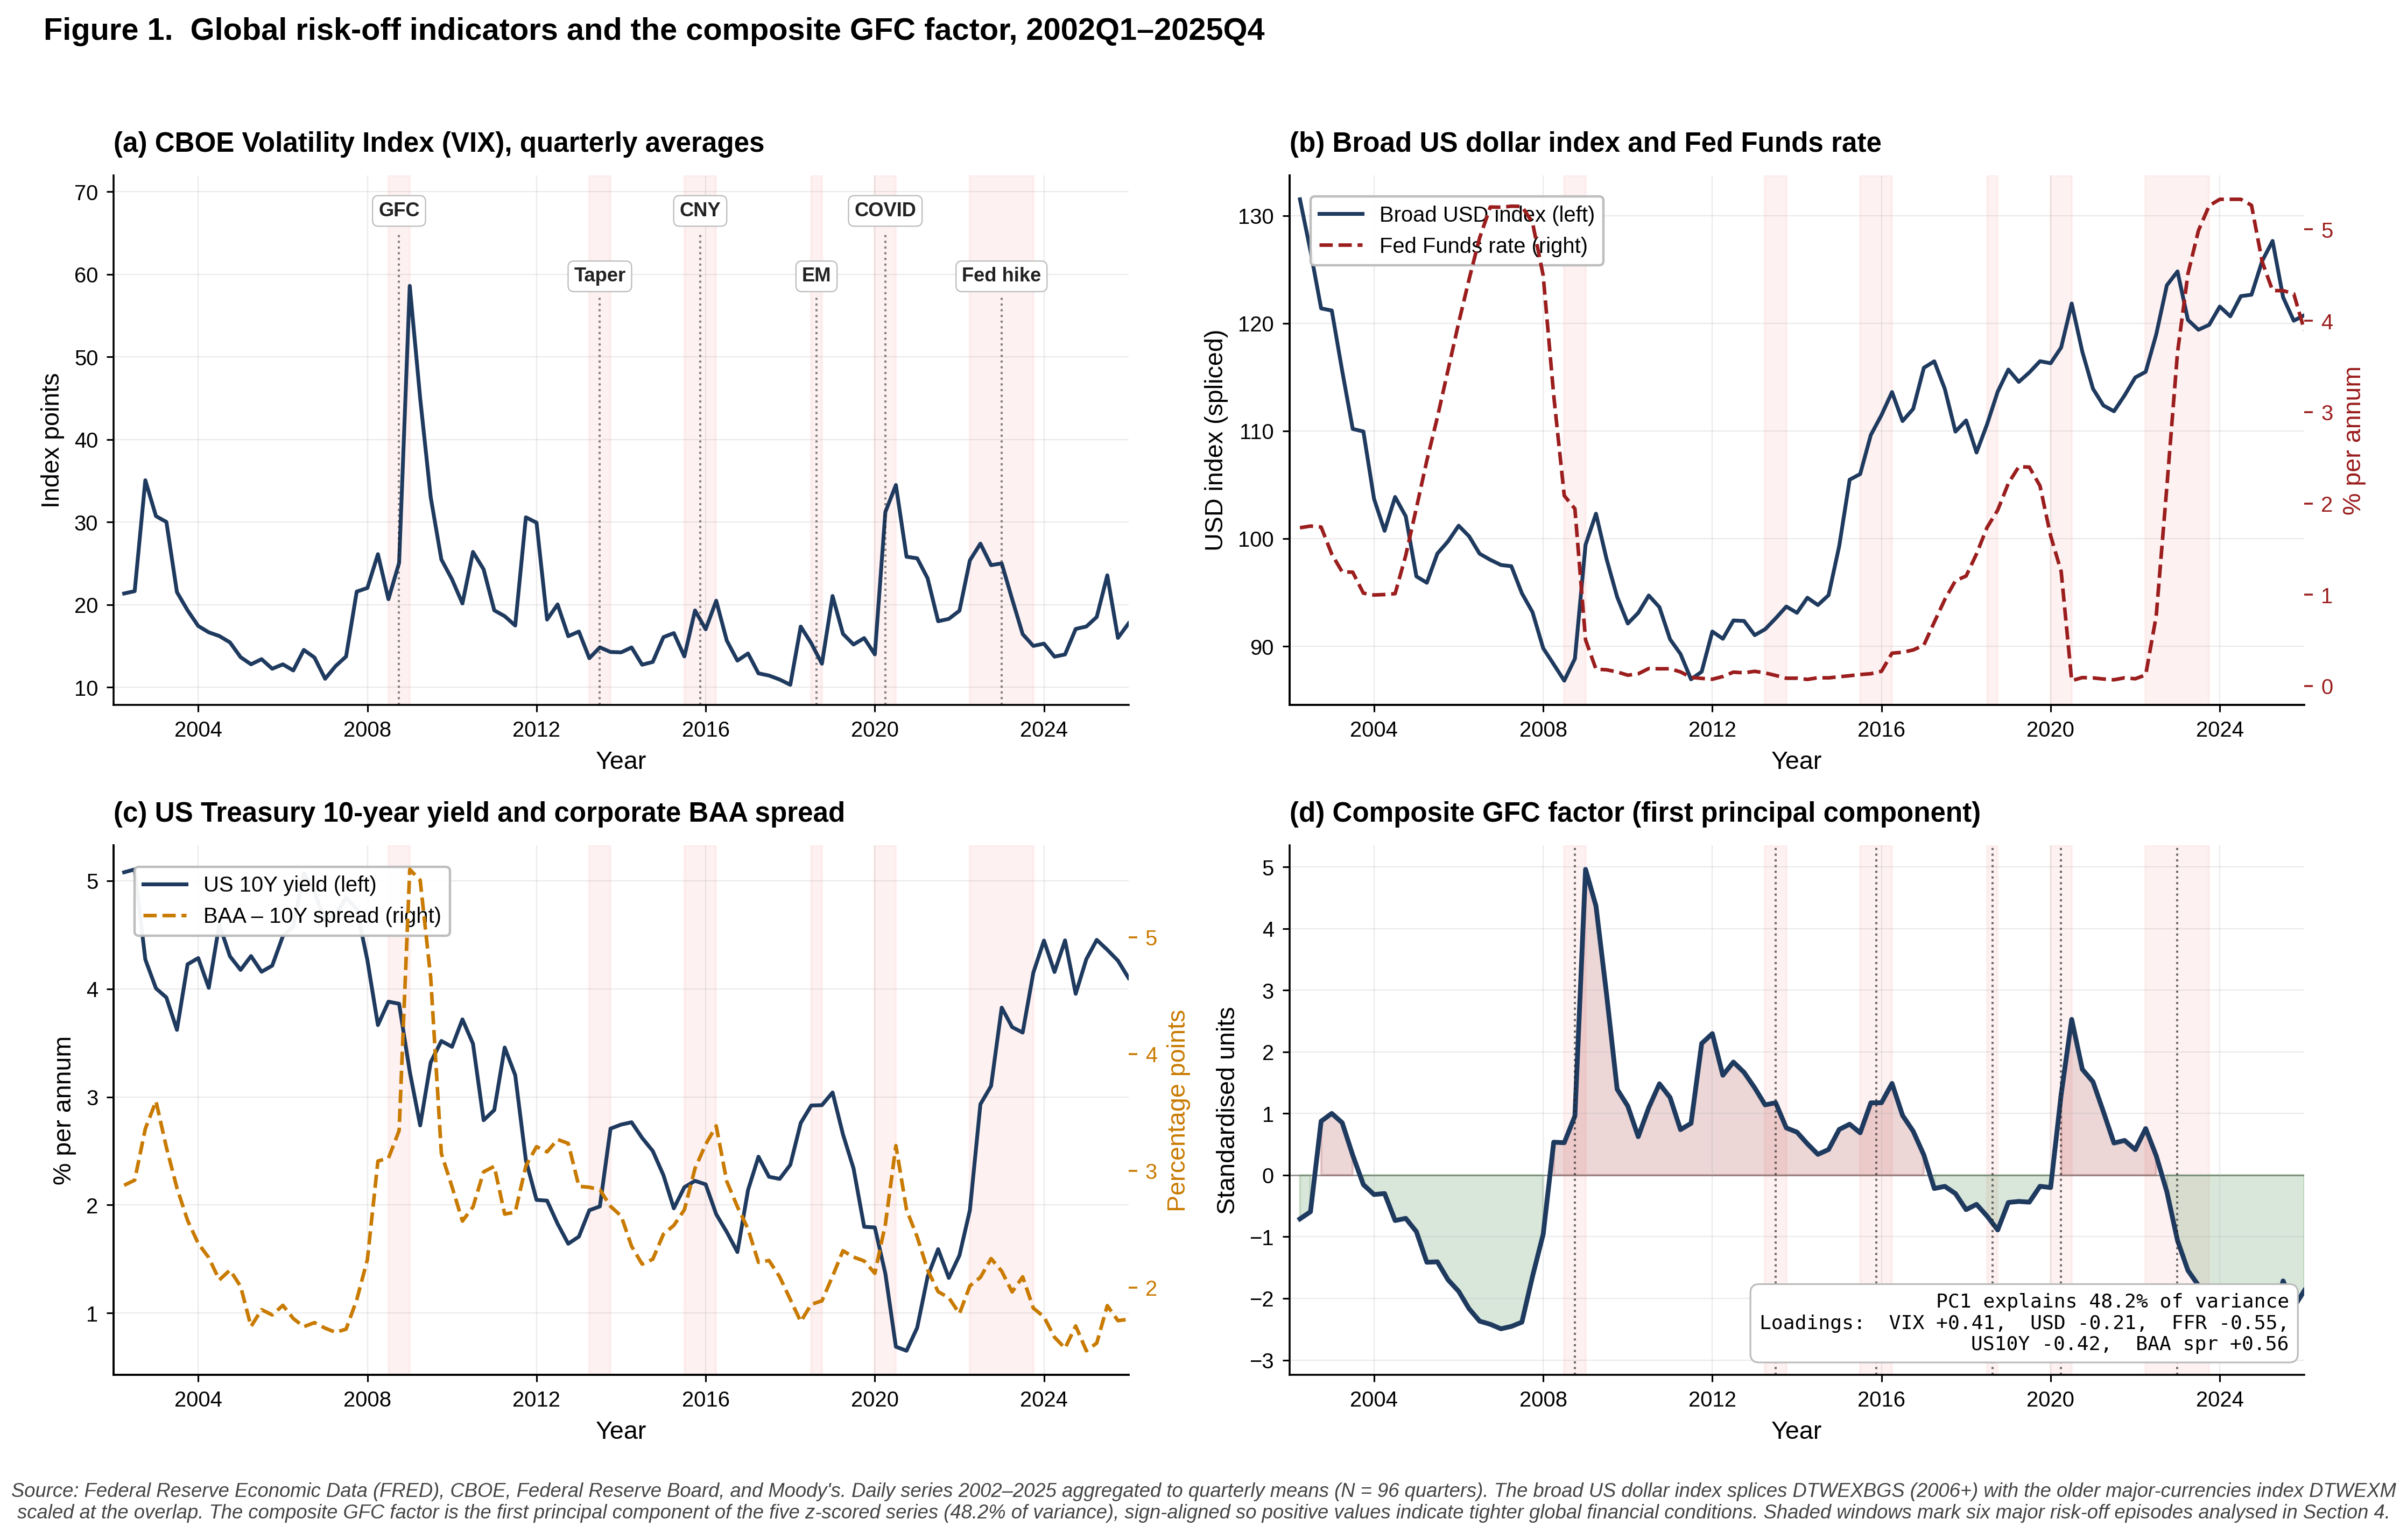
Table 1 — Summary statistics, global risk-off indicators
| Variable | Units | FRED ID | N | Mean | SD | p10 | p90 |
|---|---|---|---|---|---|---|---|
| VIX | Index points | VIXCLS | 96 | 19.9 | 7.4 | 12.7 | 30.5 |
| Broad USD index | Index, spliced | DTWEXBGS + DTWEXM | 96 | 104.7 | 10.2 | 92.4 | 121.4 |
| Fed Funds rate | % p.a. | DFF | 96 | 1.79 | 1.85 | 0.08 | 5.05 |
| US 10Y yield | % p.a. | DGS10 | 96 | 3.13 | 1.18 | 1.59 | 4.71 |
| BAA – 10Y spread | pp | BAA10Y | 96 | 2.62 | 1.05 | 1.74 | 3.78 |
| Composite GFC factor | z-score | PCA · this paper | 96 | 0.00 | 1.55 | −2.13 | 1.94 |
3. Figure 2 — Bank-level FX exposure proxy
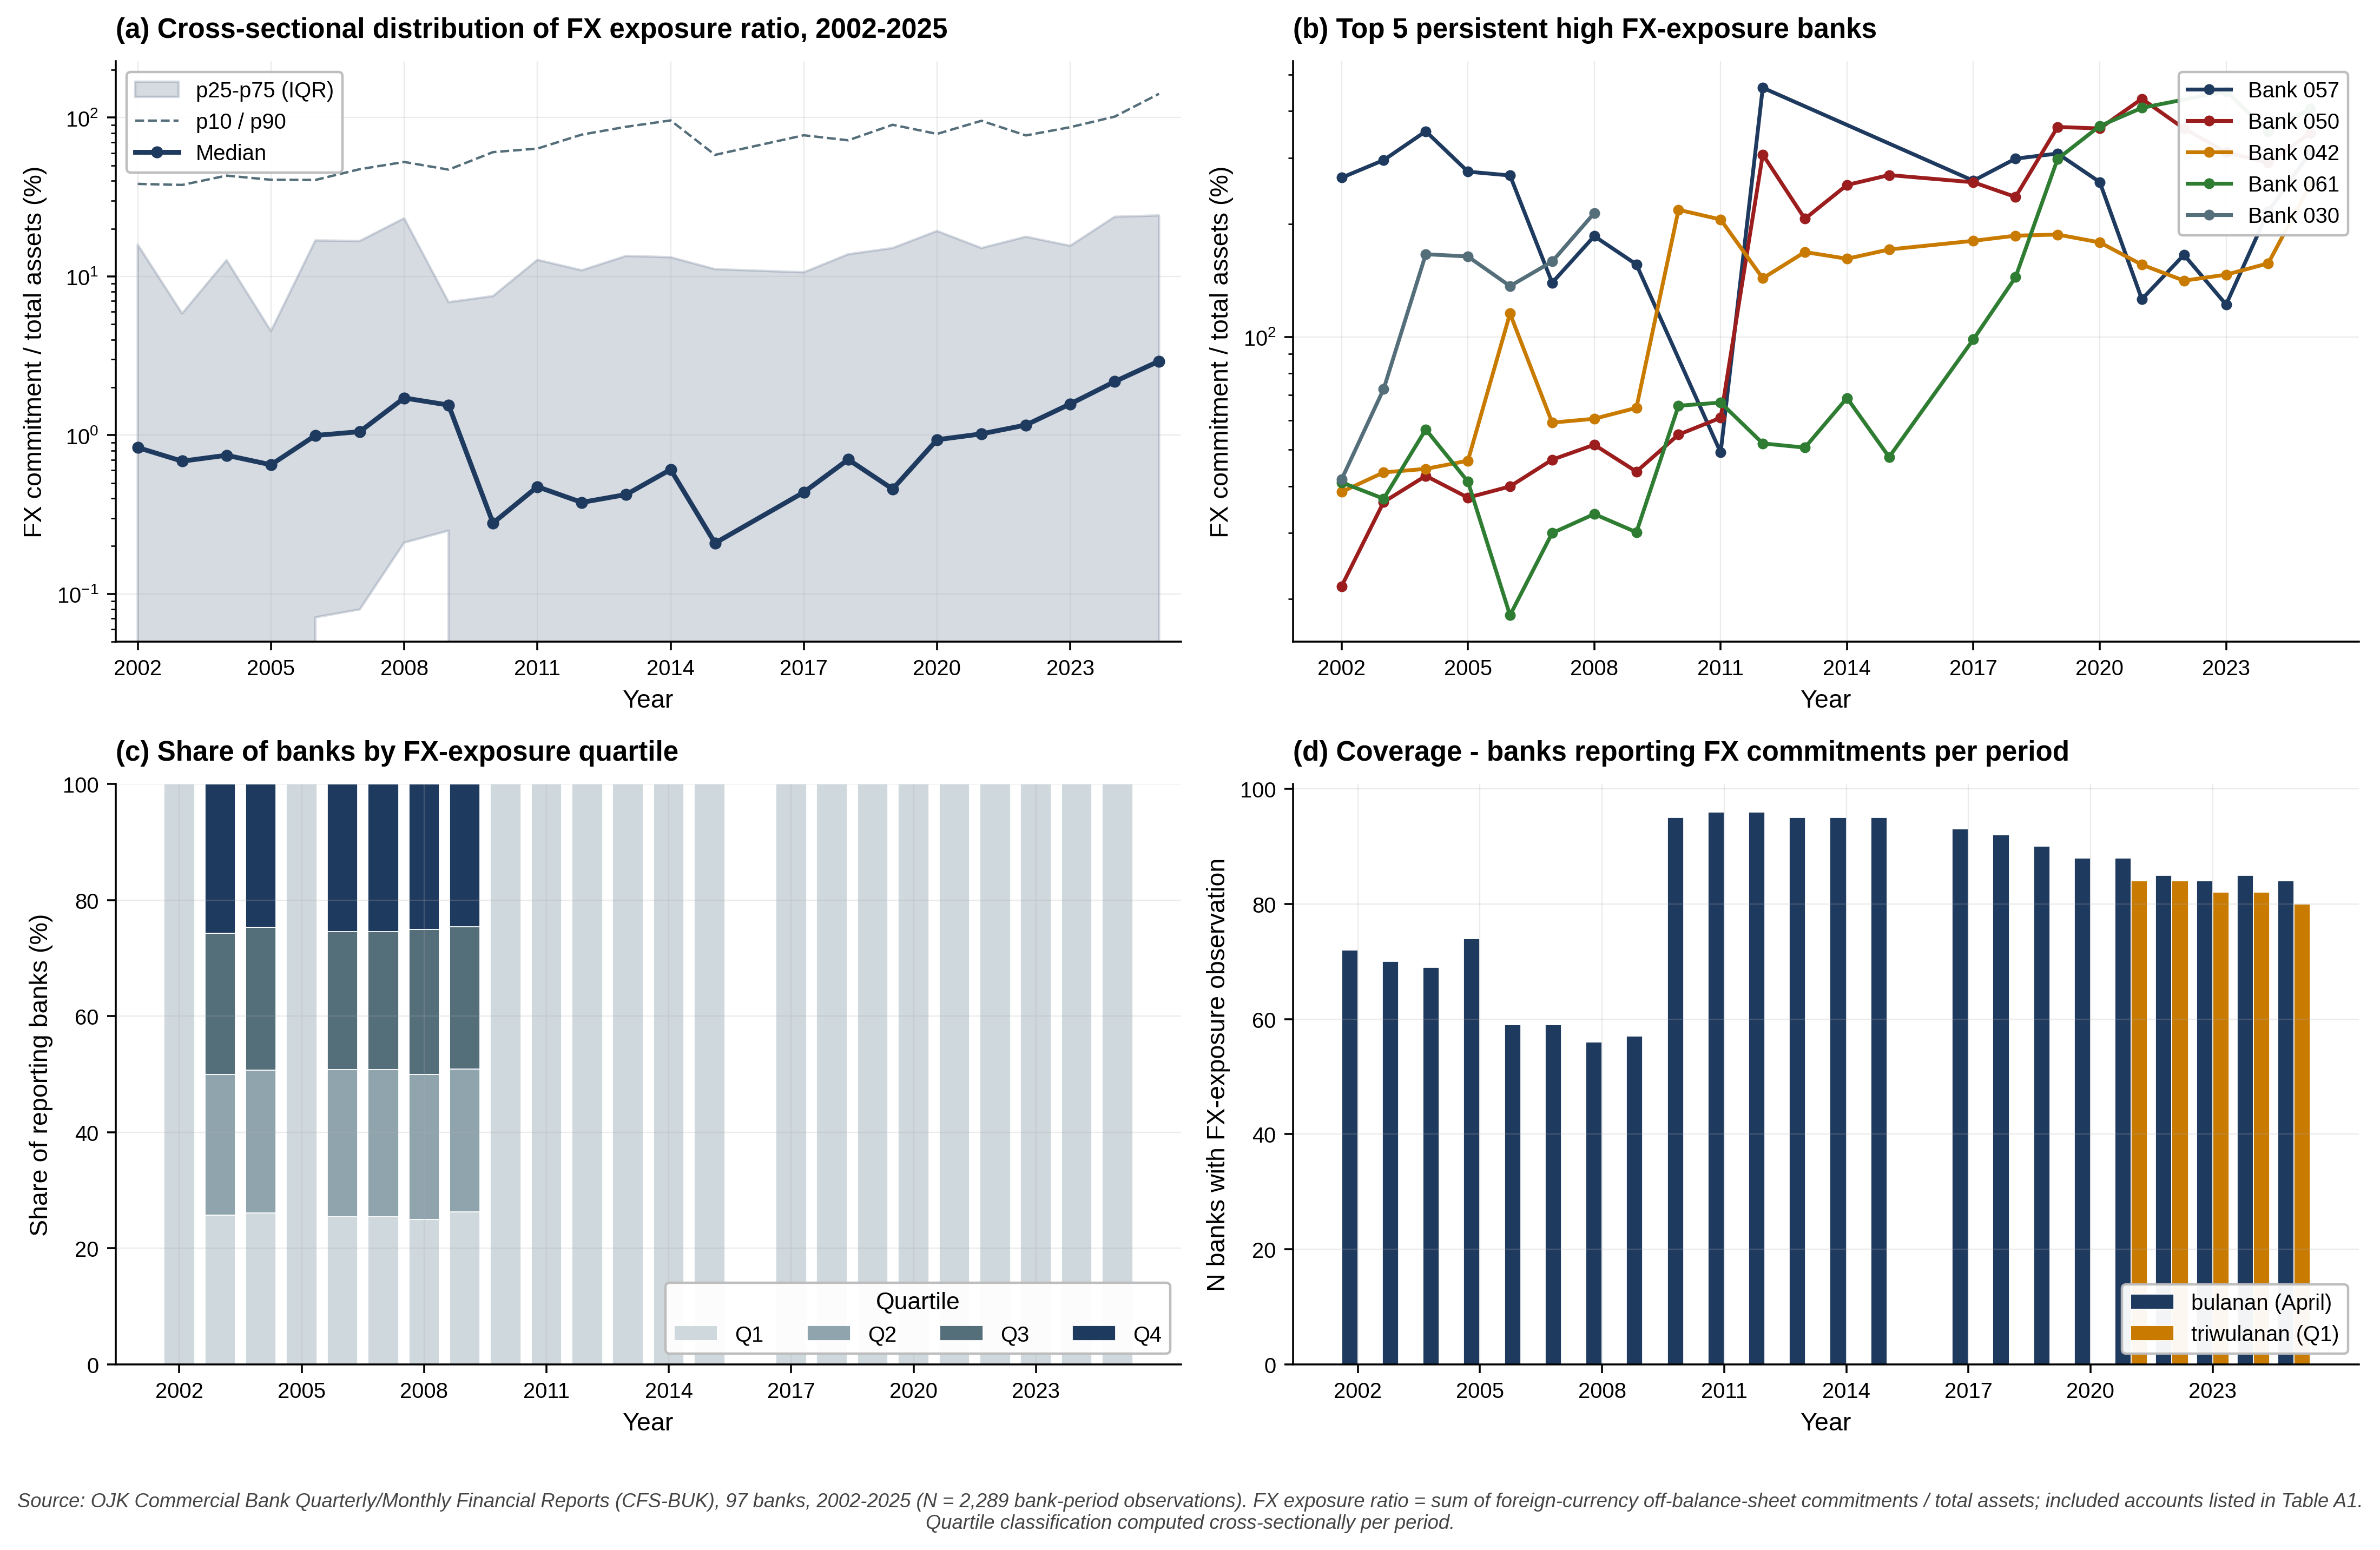
Figure 2. Cross-sectional distribution of FX exposure across BUK, 2002–2025
FX exposure = sum of foreign-currency off-balance-sheet commitments (eleven matched account labels in komitmen-kontinjensi) divided by total assets. Panel (a) shows the cross-sectional median + p25–p75 band over time; panel (b) the five persistent-high-exposure banks (foreign branches); panel (c) the share of banks in each FX-exposure quartile; panel (d) data availability by period.
4. Figure 3 — CAR & NPL gross, bridged panel
Figure 3. Capital adequacy and credit quality of Indonesian commercial banks (BUK), 2002–2025
Two regulatory-template formats bridged: kpmm_konsolidasi & kualitas_aktiva_produktif (Basel I → II.5 era, 2002–2015) and rasio_keuangan & kualitas_aset (Basel III era, 2021–2025). Panels (a) and (b) are within-new-format concordance scatters (r > 0.98 confirms extraction consistency). Panels (c) and (d) show cross-sectional bands over time. Grey 2016–2020 band = parsing gap in the source archive.
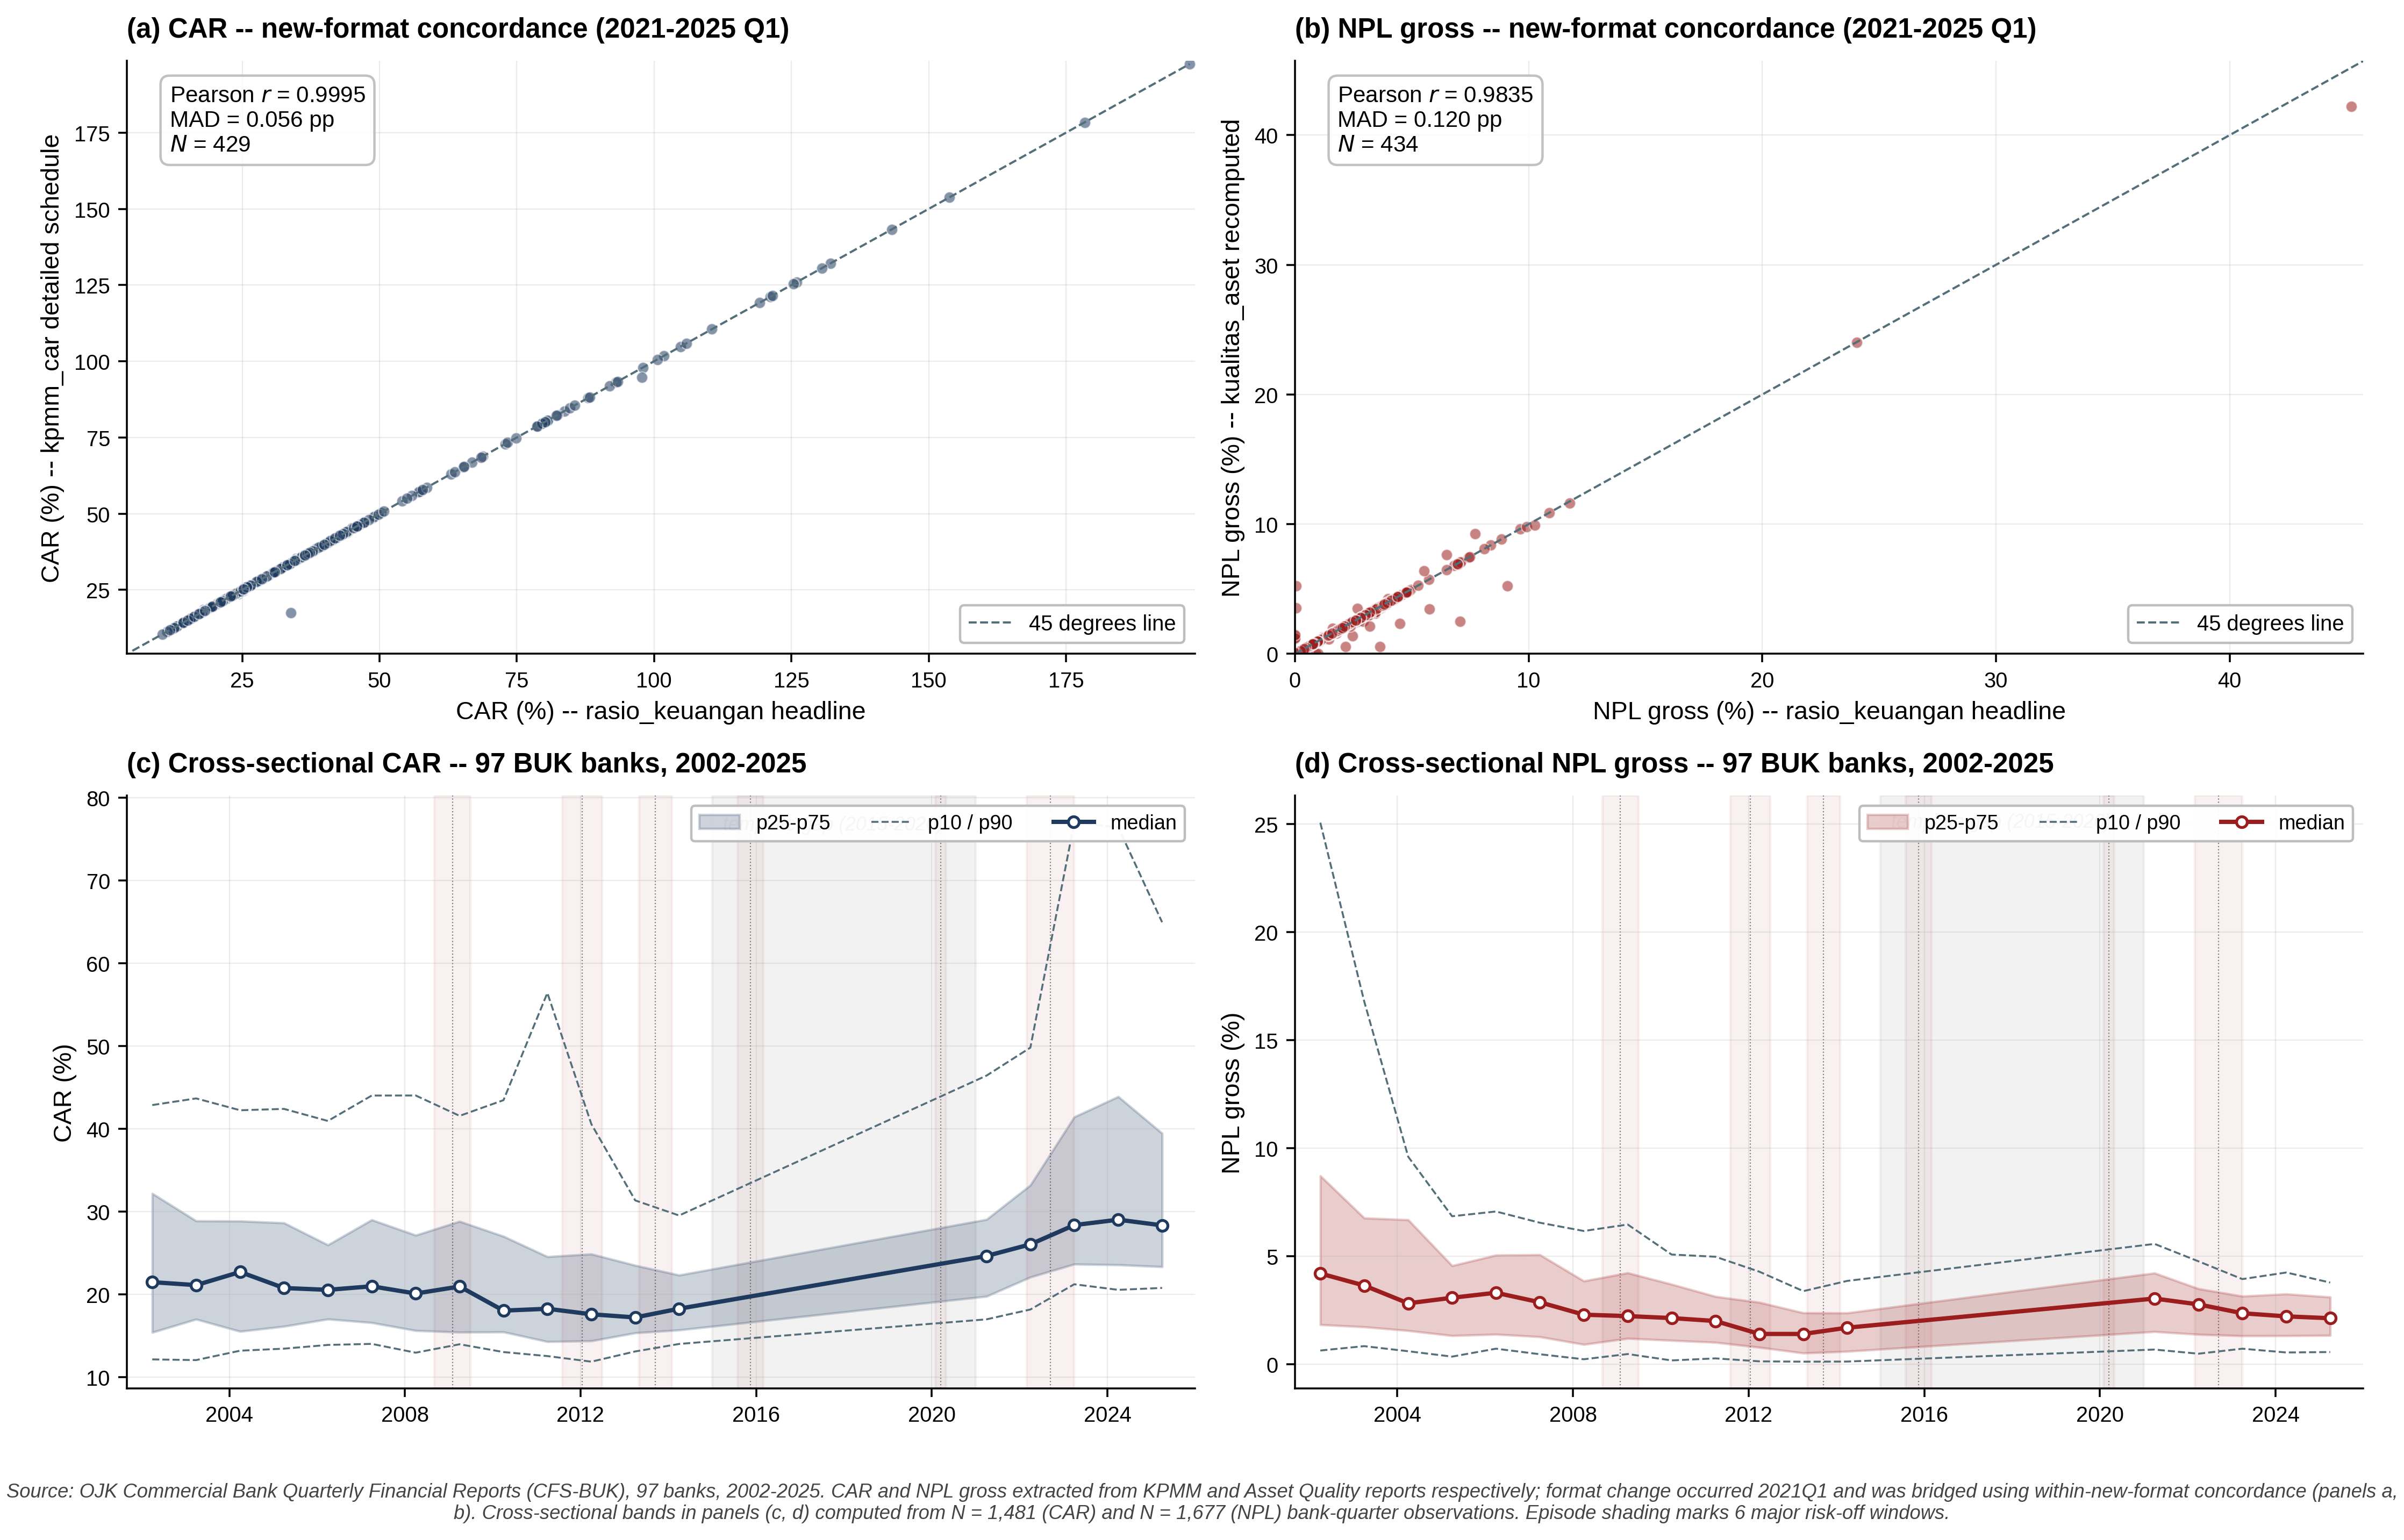
no_report across all 98 banks). The gap reflects the POJK 14/2017 reporting-format transition. CAR / NPL panel coverage is therefore 2002–2015 ∪ 2017–2025 for the old-format reports (kpmm_konsolidasi, kualitas_aktiva_produktif) and 2021–2025 for the new-format reports (rasio_keuangan, kpmm_car, kualitas_aset). All six risk-off episodes (GFC, Taper, CNY, EM, COVID, Fed hike) remain covered.
5. Figure 4 — Outcome panel: assets, credit, deposits
Figure 4. Aggregate and cross-sectional balance-sheet dynamics of Indonesian commercial banks (BUK), 2002–2025
Continuous annual coverage from posisi keuangan bulanan (April snapshots), with a label splice total aktiva → total aset at 2010 and kredit yang diberikan → kredit over the same window. Panel (a) aggregate banking-system assets; panel (b) the cross-sectional credit-to-asset ratio; panel (c) cross-sectional credit growth YoY; panel (d) aggregate assets, credit, and DPK indexed to 2002 = 100 on a log scale. Grey 2016 band = single missing snapshot.
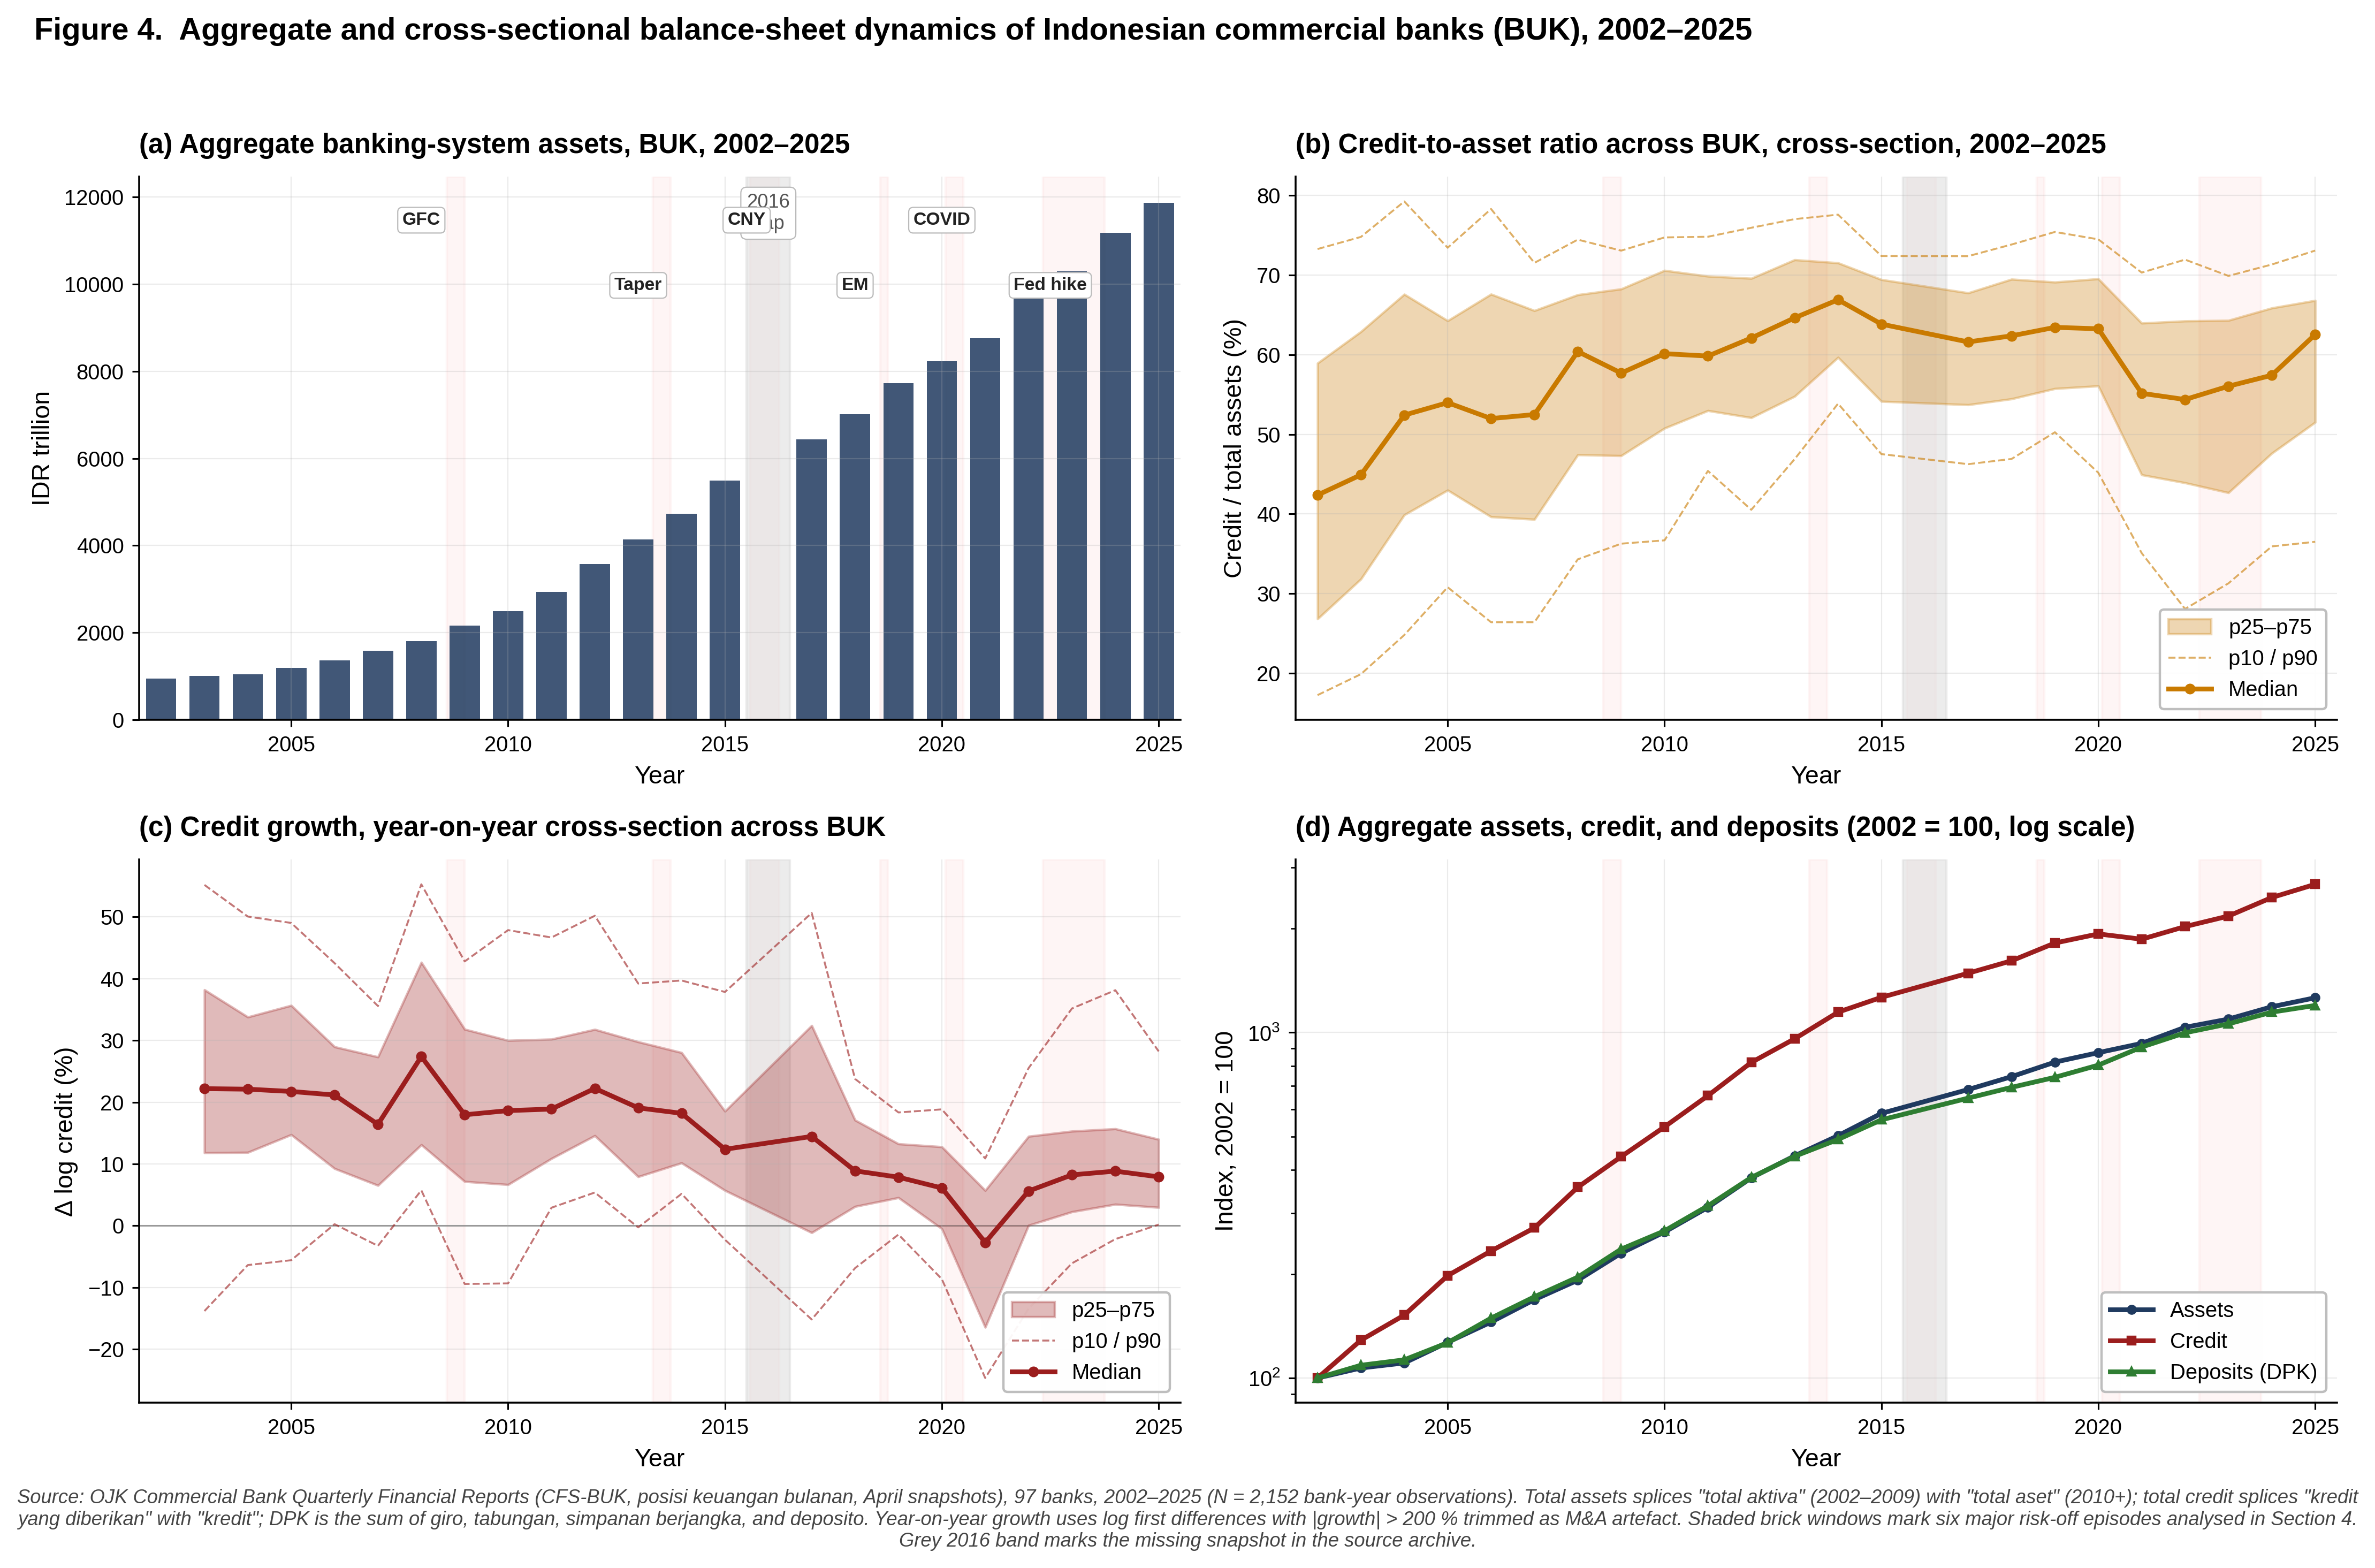
Table 4 — Outcome variables, 2002–2025 full-sample
| Variable | N | Mean | SD | p10 | Median | p90 |
|---|---|---|---|---|---|---|
| Total assets (IDR trillion) | 2,152 | 69.2 | 192.5 | 1.0 | 11.5 | 175.4 |
| Total credit (IDR trillion) | 2,150 | 42.6 | 122.1 | 0.6 | 6.9 | 110.2 |
| Total DPK (IDR trillion) | 2,150 | 52.4 | 148.3 | 0.7 | 8.5 | 134.6 |
| Credit / assets (%) | 2,150 | 61.3 | 15.7 | 40.8 | 62.7 | 78.4 |
| Asset growth YoY (%) | 2,050 | 13.4 | 20.5 | −5.8 | 10.7 | 34.6 |
| Credit growth YoY (%) | 2,043 | 14.7 | 27.9 | −10.6 | 11.9 | 40.3 |
| DPK growth YoY (%) | 2,049 | 13.5 | 21.7 | −5.2 | 10.9 | 34.8 |
6. Figure 5 — Master estimation panel overview
Figure 5. Master estimation panel — overview, descriptives, and headline correlations
The four component streams (outcome panel, GFC shock series, FX exposure proxy, CAR / NPL bridge) merge into a single bank-year master panel. Panel (a) shows the unconditional Pearson correlation matrix; panel (b) the composition of the BUK universe by ownership type (derived from 2021–2024 susunan top-owner); panels (c) and (d) collapse to annual cross-sectional medians and plot against the composite GFC factor with linear-fit overlay and per-year labels.
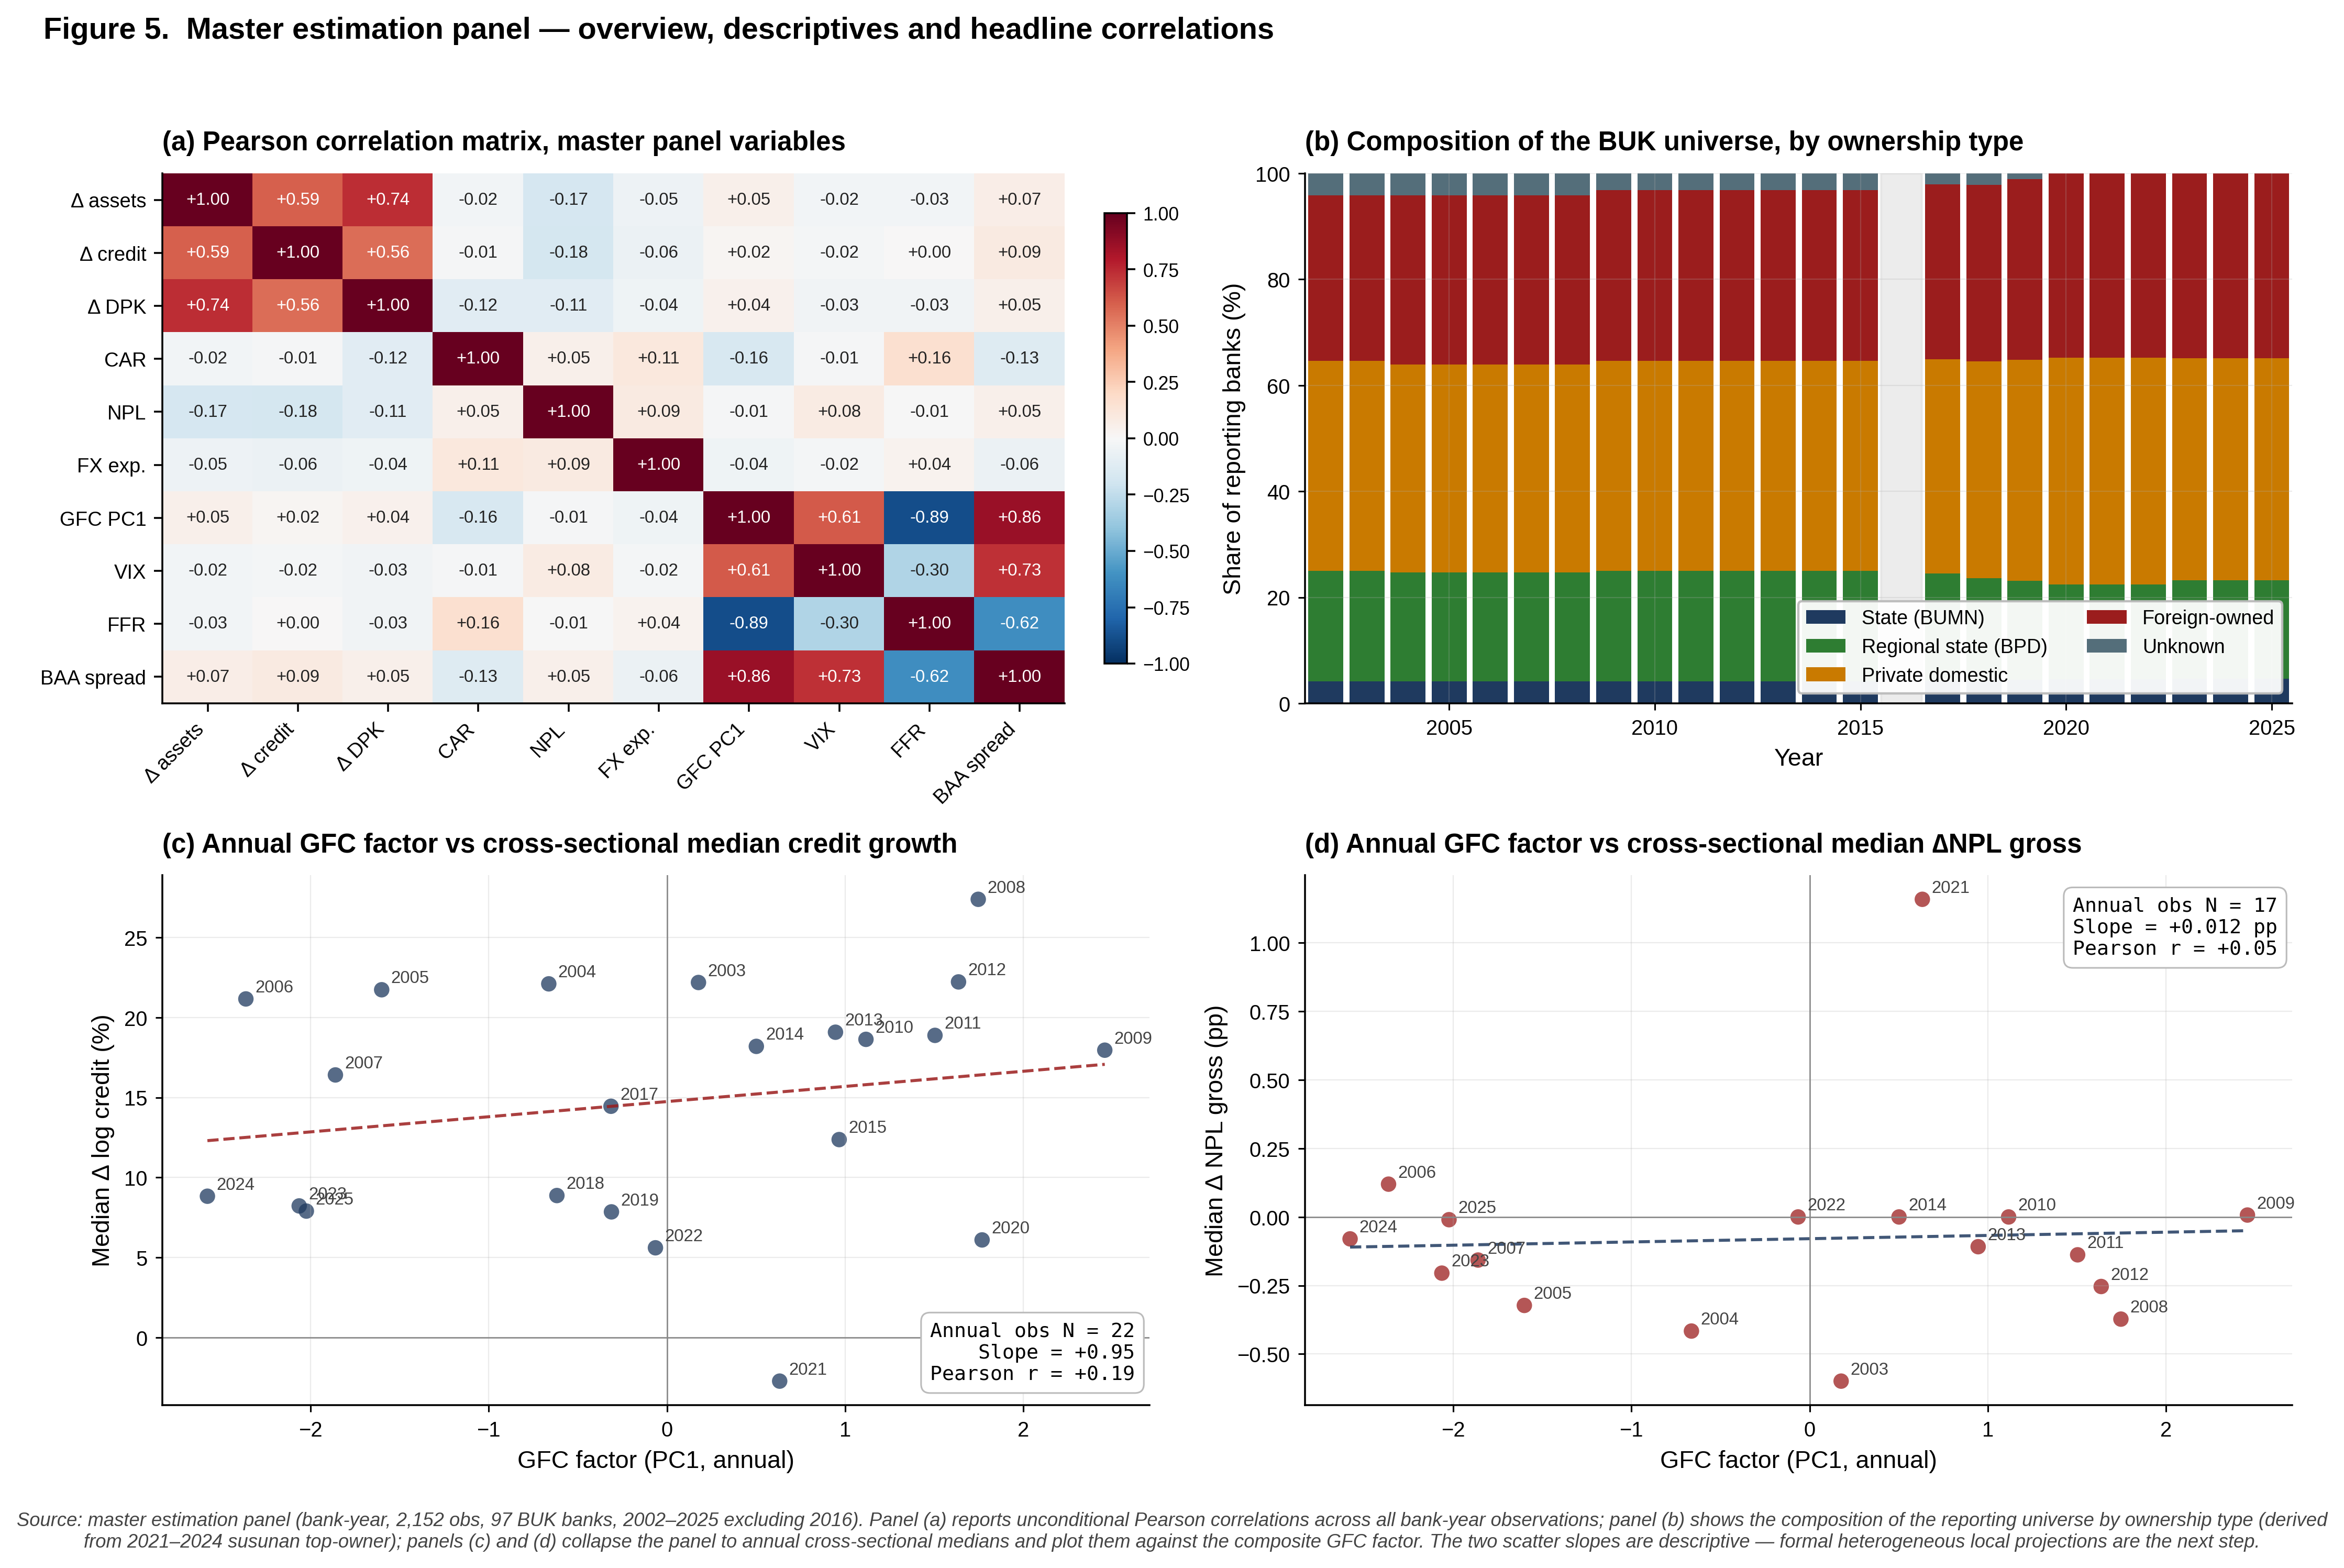
Table 5 — Master estimation panel descriptives, 2002–2025 excl. 2016
| Variable | N | Mean | SD | p10 | Median | p90 |
|---|---|---|---|---|---|---|
| Total assets (IDR trillion) | 2,152 | 69.2 | 192.5 | 1.0 | 11.5 | 175.4 |
| Total credit (IDR trillion) | 2,150 | 42.6 | 122.1 | 0.6 | 6.9 | 110.2 |
| Credit / assets | 2,150 | 0.61 | 0.16 | 0.41 | 0.63 | 0.78 |
| Asset growth YoY (∆ln) | 2,050 | 0.134 | 0.205 | −0.058 | 0.107 | 0.346 |
| Credit growth YoY (∆ln) | 2,043 | 0.147 | 0.279 | −0.106 | 0.119 | 0.403 |
| CAR (%) | 1,481 | 28.4 | — | 13.7 | 22.2 | 45.9 |
| NPL gross (%) | 1,677 | 3.7 | — | 0.3 | 2.4 | 6.7 |
| FX exposure ratio | 1,879 | — | — | ~0.005 | ~0.03 | ~1.4 |
| GFC factor (annual) | 2,152 | 0.00 | 1.55 | −2.13 | −0.04 | 1.94 |
7. Baseline Local Projections — first headline results
Table 6 — Baseline LP, bank FE, SE clustered by bank
| Outcome | h = 1 | h = 2 | h = 3 | h = 5 |
|---|---|---|---|---|
| Δ log credit | −0.003 (0.005) | +0.016* (0.009) | +0.046*** (0.012) | +0.049*** (0.012) |
| Δ log assets | −0.001 (0.003) | +0.008 (0.005) | +0.030*** (0.007) | +0.030*** (0.009) |
| Δ NPL gross (pp) | +0.055 (0.040) | −0.034 (0.064) | −0.254** (0.126) | −0.307*** (0.117) |
| Δ CAR (pp) | +0.162 (0.217) | +0.120 (0.381) | −0.795** (0.333) | −0.498 (0.371) |
Figure 6. Heterogeneous GFC transmission, h = 2 LP
Coefficient (with 95 % CI bars) on the GFC × group interaction in a 2-year horizon LP with bank + year fixed effects. With year FE absorbing the main effect, each row is the additional response of the listed group relative to the omitted base (bank_type = foreign; size_quintile = 1; fx_quartile = 1). Panel (a) shows the credit-growth response, panel (b) the NPL-gross response.
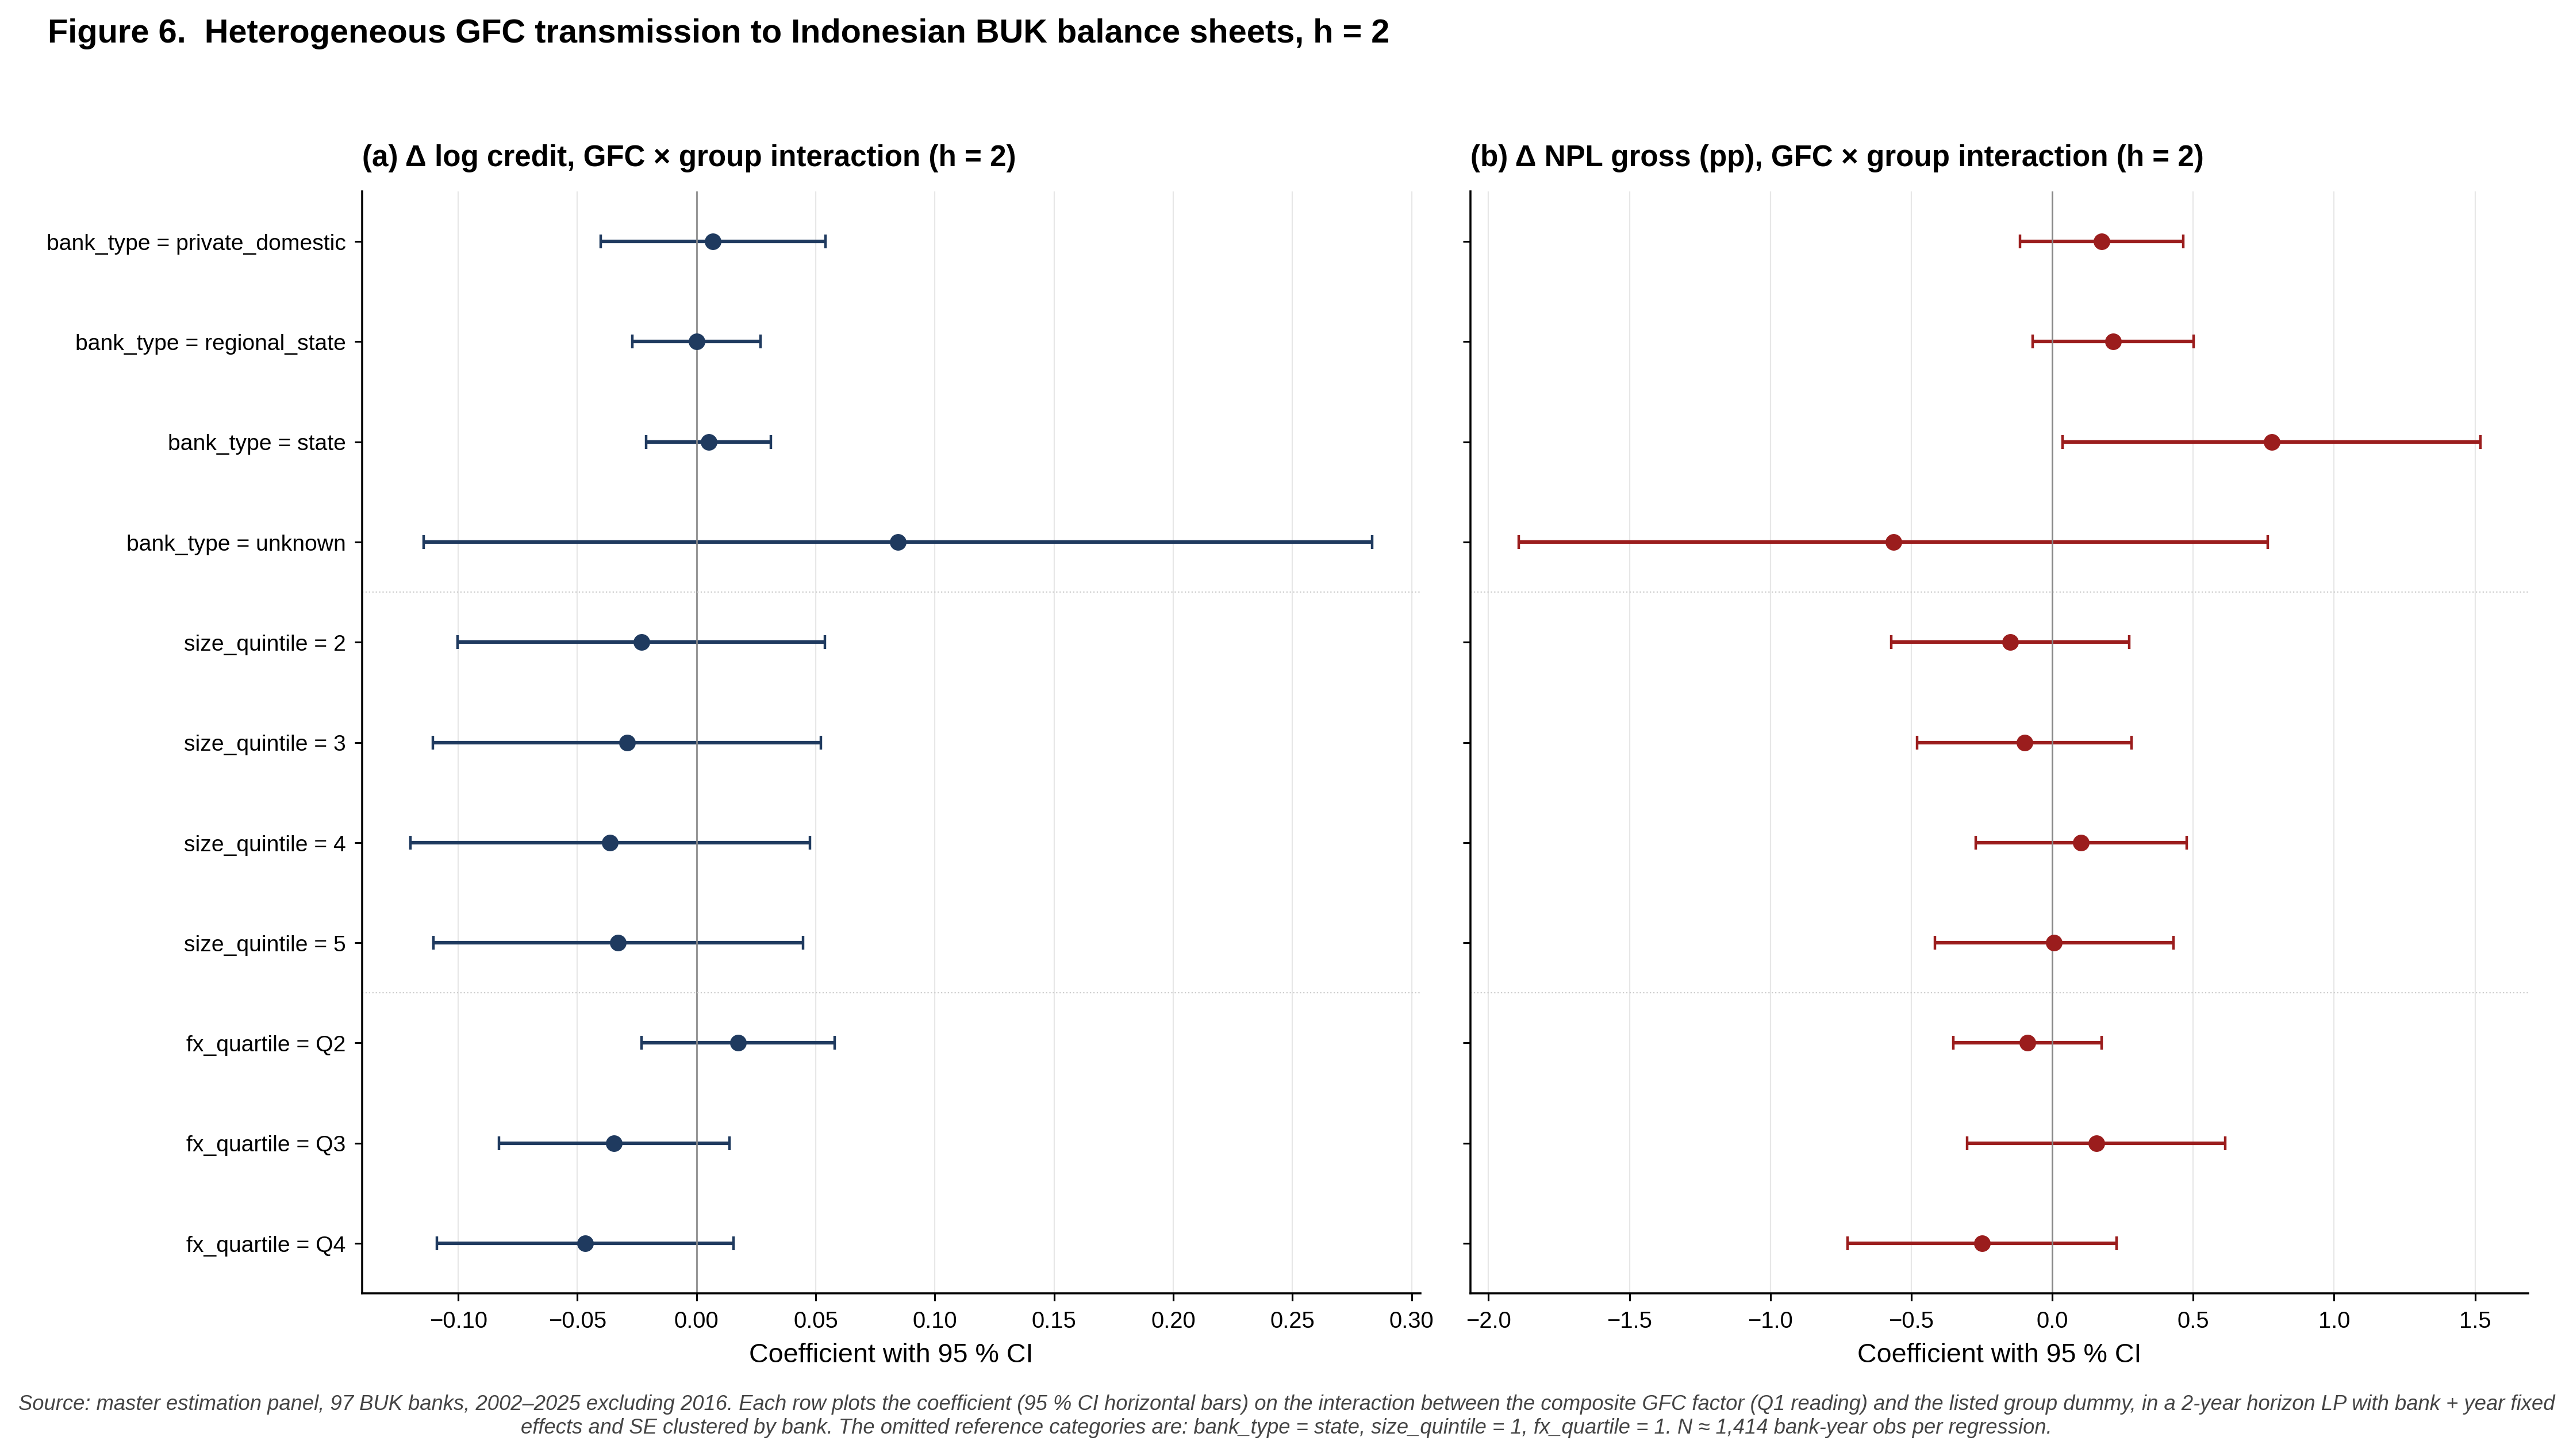
- State (BUMN) banks see NPL rise more during stress (+0.78 pp**) but CAR also rises (+1.65 pp**) — consistent with government recapitalisation support.
- High-FX-exposure banks (Q3, Q4) deleverage assets more strongly during global stress (Δ log assets −0.038**, −0.046**).
- Size quintiles are not statistically distinguishable — the cross-section is dominated by ownership type, not size.
Table 8 — Episode event-study, h = 2 LP
| Episode | Δ log credit | Δ log assets | Δ NPL (pp) | Δ CAR (pp) |
|---|---|---|---|---|
| GFC 2008–09 | −0.115** (0.056) | −0.052 (0.032) | +1.217** (0.514) | +2.123 (1.774) |
| Taper tantrum 2013 | +0.111*** (0.034) | +0.106*** (0.029) | — | — |
| CNY / commodity 2015–16 | +0.065 (0.067) | +0.037 (0.047) | — | — |
| EM contagion 2018 | −0.033 (0.032) | −0.040* (0.024) | — | — |
| COVID 2020 | −0.156*** (0.052) | +0.027 (0.049) | — | — |
| Fed hike 2022–23 | +0.090* (0.047) | +0.004 (0.028) | −1.290** (0.654) | −3.471 (2.282) |
8. Robustness — does the baseline survive?
The baseline GFC coefficient on Δ log credit at h = 3 (β = +0.046***) is stress-tested with six robustness checks. The headline finding survives all six, with one substantive revision to the narrative on the post-2016 period.
Figure 7. Robustness of the baseline GFC transmission coefficient
Each row plots the coefficient (with 95 % CI bars) on the composite GFC factor in the focal regression of Δ log credit at h = 3. Brick dotted line marks the baseline point estimate.
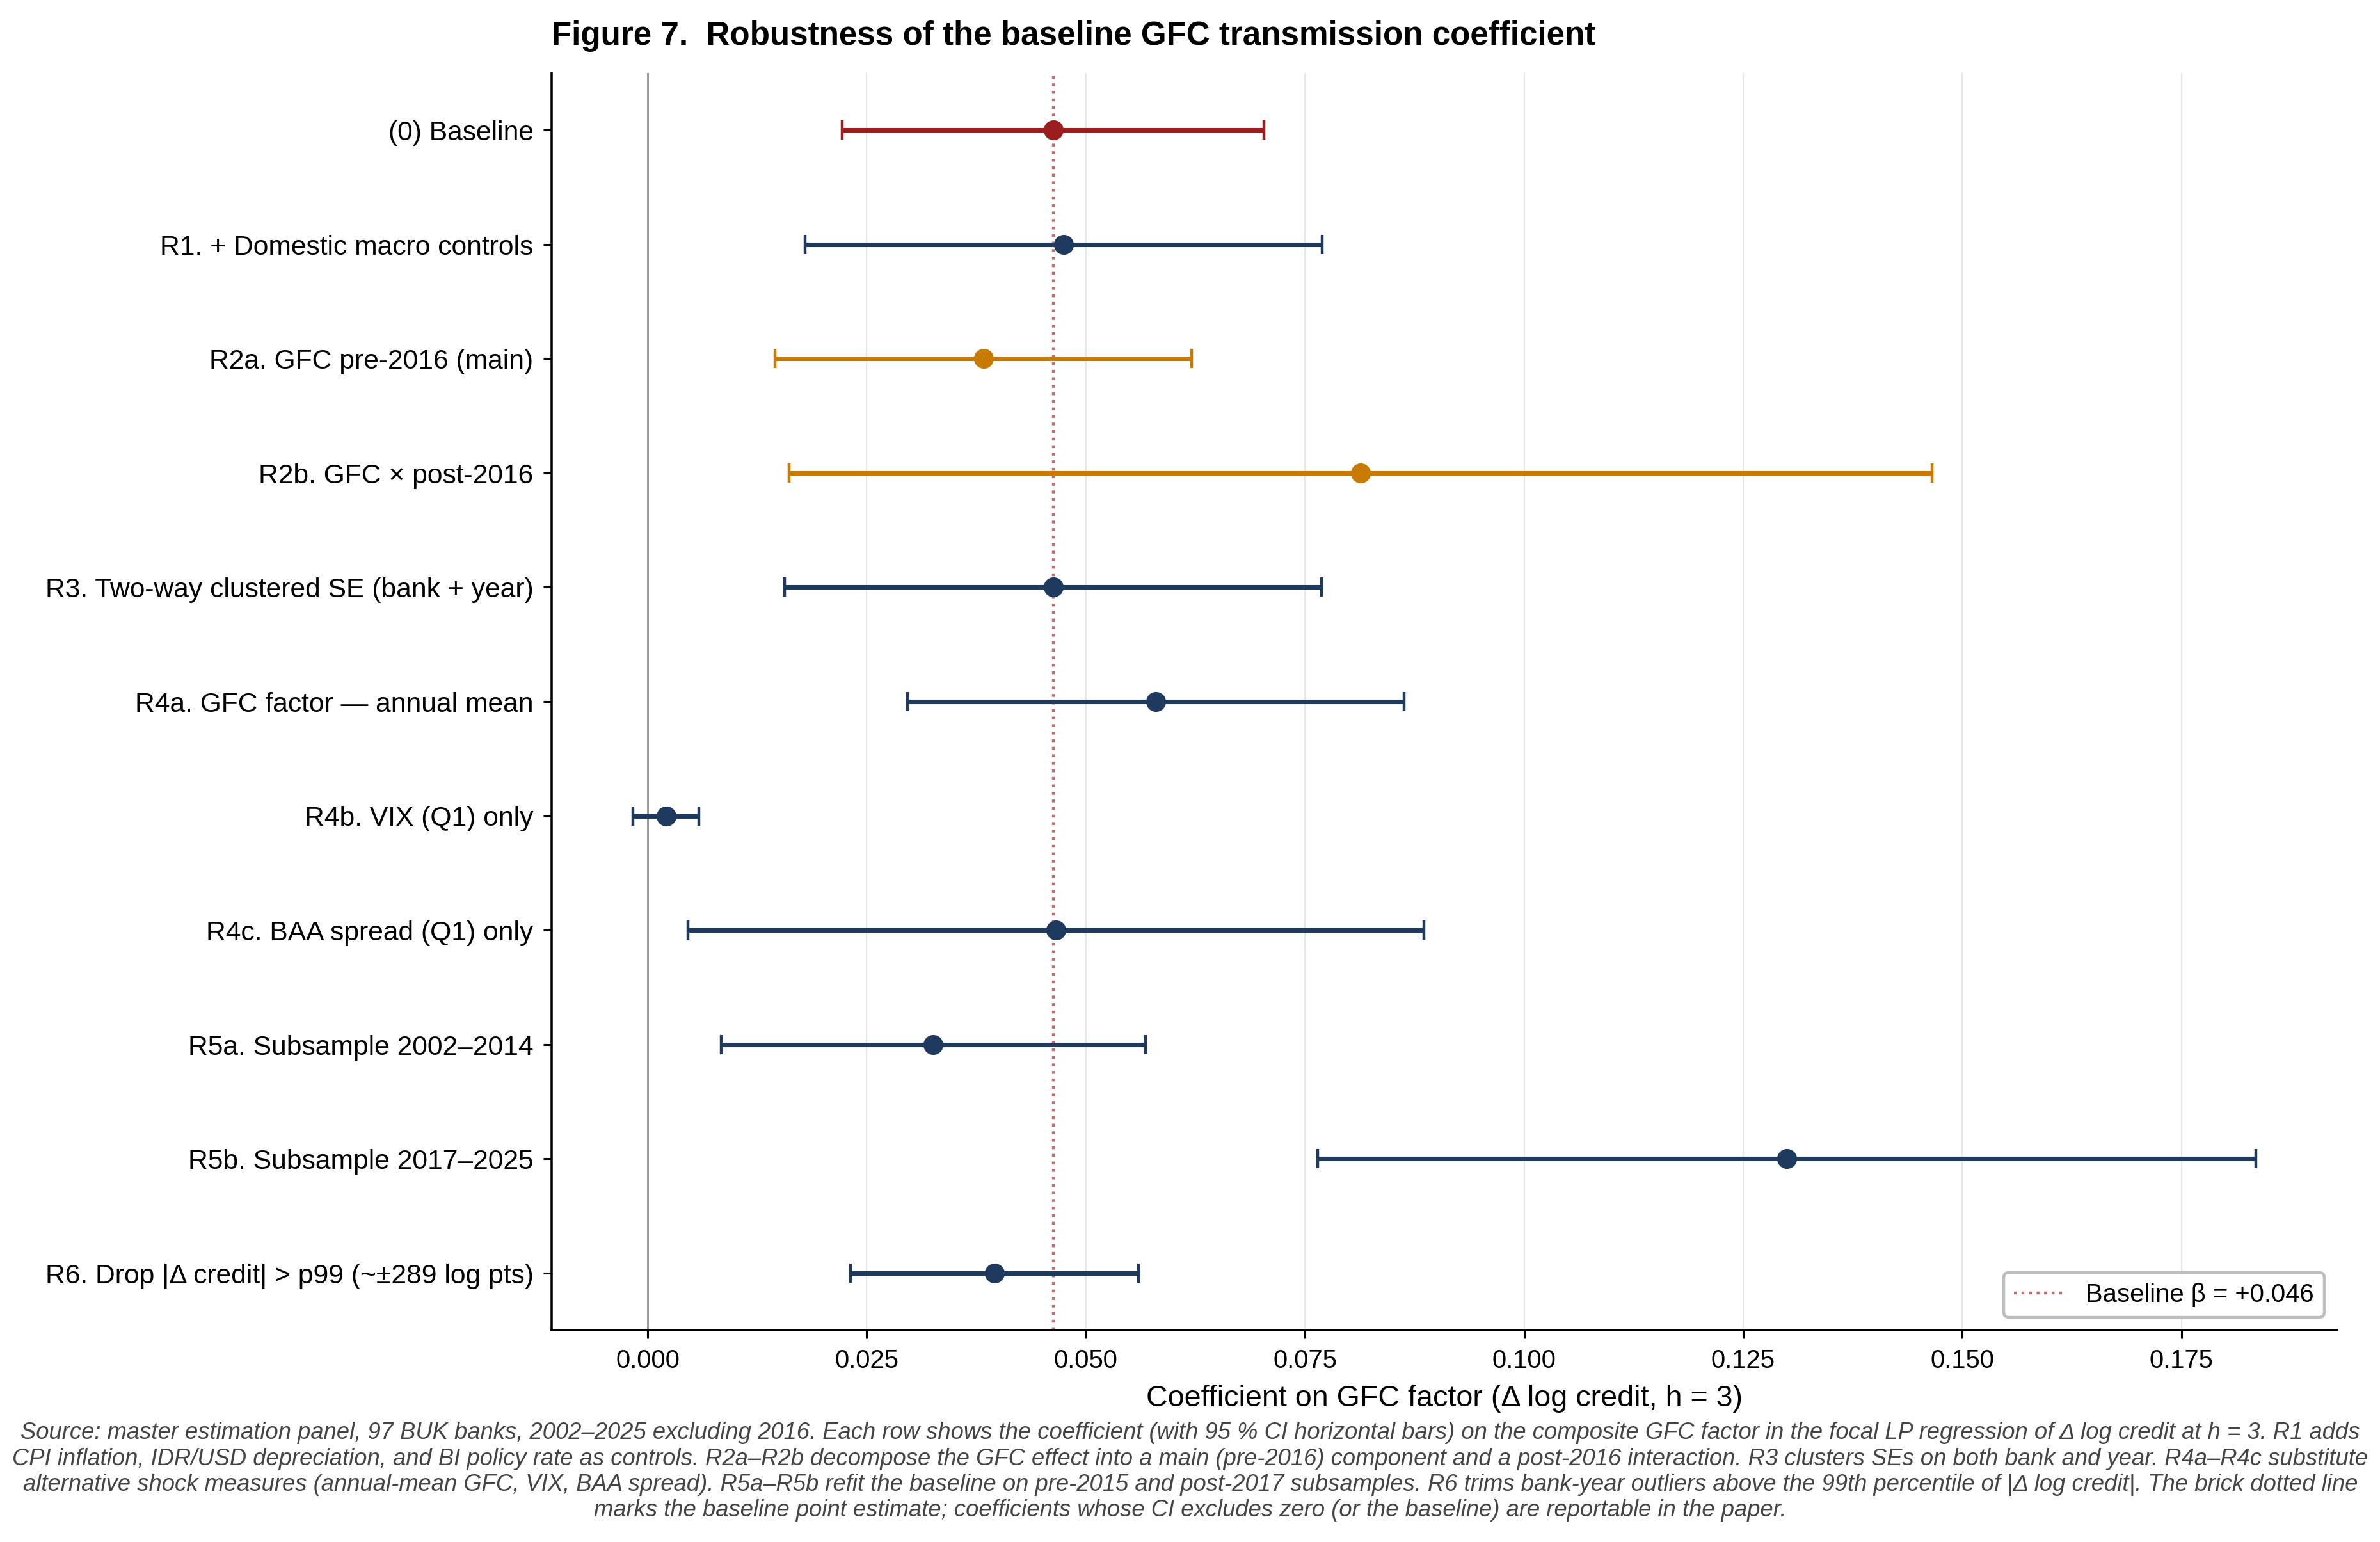
Table 9 — Robustness of baseline coefficient (Δ log credit, h = 3)
| Specification | Coefficient (SE) | N obs |
|---|---|---|
| (0) Baseline | +0.046*** (0.012) | 1,757 |
| R1. + Domestic macro controls (CPI, IDR/USD, BI rate) | +0.047*** (0.015) | 1,757 |
| R2a. GFC pre-2016 (main) | +0.038*** (0.012) | 1,757 |
| R2b. GFC × post-2016 | +0.081** (0.033) | 1,757 |
| R3. Two-way clustered SE (bank + year) | +0.046*** (0.016) | 1,757 |
| R4a. GFC factor — annual mean | +0.058*** (0.014) | 1,757 |
| R4b. VIX (Q1) only | +0.002 (0.002) | 1,757 |
| R4c. BAA spread (Q1) only | +0.047** (0.021) | 1,757 |
| R5a. Subsample 2002–2014 | +0.033*** (0.012) | 1,145 |
| R5b. Subsample 2017–2025 | +0.130*** (0.027) | 521 |
| R6. Drop |Δ credit| > p99 | +0.040*** (0.008) | 1,740 |
- R1 (domestic controls): β virtually unchanged (+0.046 → +0.047***), so GFC is not proxying for BI rate, IDR/USD, or CPI inflation.
- R2 + R5 (the surprise): The post-2016 GFC sensitivity is materially larger, not smaller — interaction +0.081**, subsample β almost 4× the pre-2014 magnitude (+0.130 vs +0.033). Indonesian banks became more coupled to the global financial cycle after the macroprudential framework activation, not less.
- R4b vs R4c: The composite factor's transmission is driven by credit-spread movements (BAA spread), not volatility (VIX). VIX alone has zero predictive power for Indonesian bank credit. This refines the channel interpretation.
- R6 (outliers): Trimming the top 1 % of |Δ log credit| (M&A spikes) leaves β nearly identical (+0.040***). Result is not driven by a handful of merger-fueled jumps.
The post-2016 macroprudential framework appears to work asymmetrically:
- Stress side: the Fed-hike 2022–23 episode (Table 8) shows declining NPL and stable credit — macroprudential buffers do contain stress propagation.
- Boom side: the same banks transmit global accommodation phases more strongly than pre-2016 — macroprudential does not contain credit booms during easy-money periods (R2b + R5b).
This is the classic asymmetric macroprudential result documented in cross-country panels (Cerutti et al. 2017, Akinci & Olmstead-Rumsey 2018) — buffers limit downside but not upside transmission. Indonesia fits the pattern.
9. Caveats — what reviewers will ask
Frequency is annual, not quarterly
OJK CFS public release is one snapshot per year (April / Q1). The paper is therefore a bank-year panel. Most GFC episodes (GFC 2008, COVID, Fed hike) span multiple quarters and remain visible in annual data, but Taper tantrum (May–Sep 2013) shows up only as a single point in 2013-04 / 2014-04 averages — power against this episode will be modest.
2016 gap is structural (OJK source)
OJK CFS public endpoint returns no_report for fiscal year 2016 across all BUK banks and all report types — verified through two scrape attempts (May 2026, May 2026 re-test). The gap reflects the POJK 14/2017 reporting-format transition rather than any pipeline issue. The paper treats 2016 as a one-year structural gap absorbed into year fixed effects; the 2002–2015 ∪ 2017–2025 windows together cover 23 years of bank-level data including all six risk-off episodes.
FX exposure is gross, not net
The proxy sums off-balance-sheet FX-tagged commitments and normalises by total assets. It measures exposure intensity, not unhedged open FX position. Foreign-branch ratios above 500 % were dropped as suspect (likely double-counted notionals).
Identification — single small open economy
GFC shocks are exogenous to any individual Indonesian bank but not to Indonesia's macroeconomy. The paper controls for domestic macro (BI rate, IDR/USD, CPI) and identifies via bank-level heterogeneity in the GFC response, not via the existence of the GFC itself.
10. Next steps
- ✅ Master estimation panel — 2,152 bank-year obs, 97 banks (Stream E). Done.
- ✅ Baseline LP + heterogeneity + episode study — Tables 6, 7, 8 + Figure 6 (Stream F). Done — see results above.
- Write the paper — manuscript HTML in the same style as the MBG paper preview, with sections (i) introduction, (ii) data, (iii) methodology, (iv) main results, (v) heterogeneity, (vi) episode study, (vii) discussion, (viii) policy implications.
- Domestic macro controls (robustness) — add BI rate, IDR/USD, CPI as time-varying covariates to check that the GFC factor isn't proxying for domestic policy.
- Macroprudential resilience formal test — interact GFC × post-2016 dummy explicitly to confirm the regime shift hinted at by the Fed-hike-2022 episode coefficient.
- Two-way clustered SE robustness — currently bank-only; add year clustering for the bigger samples.